North Okanagan Real Estate Wrap-Up: 2025 Ends on a Positive Note
After a fairly strong start early in the year, the North Okanagan real estate market faced a few bumps before regaining some momentum to close 2025 on solid footing. Activity early on reflected confidence, but external factors — including market uncertainty tied to U.S. policies under President Trump and the impact of tariffs — briefly slowed things down through spring. By mid-year, however, the market regained some positive momentum, finishing in a balanced position with sales improving across the board.
Early Momentum
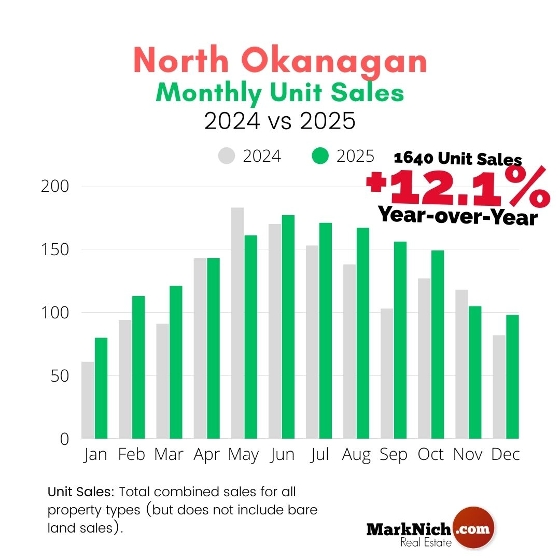
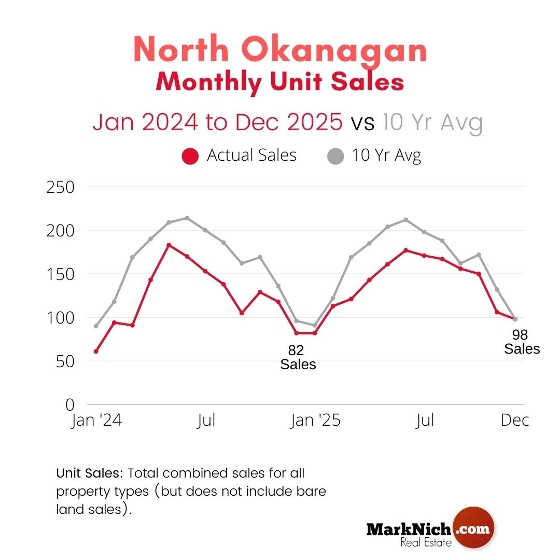
The year began with notable strength. In January, sales soared 34% year over year, though they remained about 10% below the 10-year average. February continued the upward trend, up 20% over the previous year and tracking just 7% below the 10-year-average. Both months reflected absorption rates straddling between a buyer’s and balanced market.
A Spring Slowdown
March maintained solid year-over-year gains (+33%) but lost considerable footing versus long term sales figures coming in 28% under the 10-year average. By April, growth stalled, with no change over the previous year and continued weakness compared to longer-term trends. May marked possibly the lowest point of the year, with sales down 12% year over year and 21% below the 10-year-average; although the market did move back into balanced market territory.
Steady Recovery Through Summer
The turnaround began in June, as confidence crept back into the market. Sales grew modestly by 4% compared to 2024 and closed 16.5% under the 10-year average — a marked improvement from spring’s gaps. July and August kept the momentum going with year-over-year increases of 12% and 21% respectively.
A Mixed Bag Finish
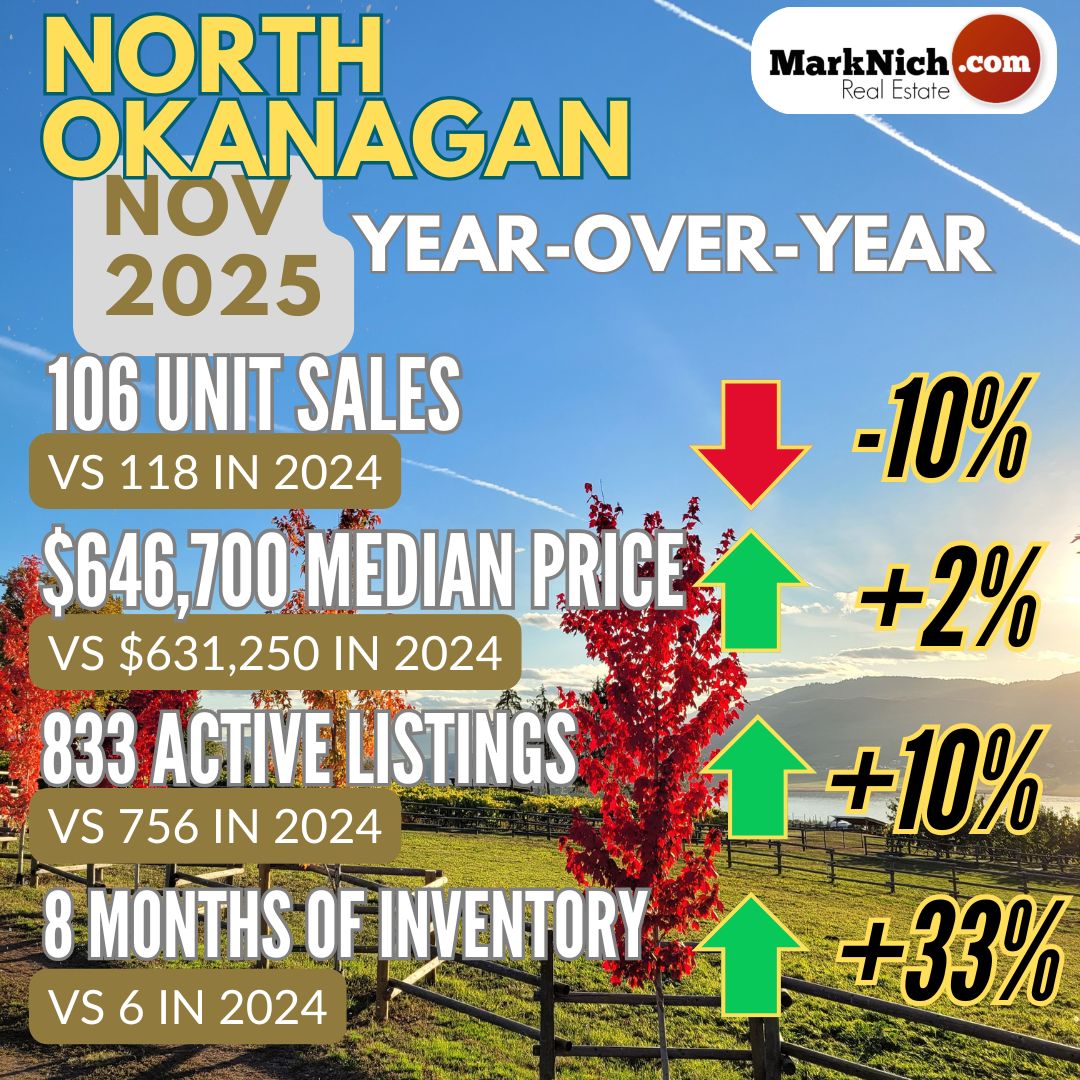
The fall months brought even stronger performance. September led the pack with a 51% year-over-year surge, bringing sales within 3.7% of the 10-year average. Things then cooled off for a couple months with October seeing an 18% bump year-over-year and 13% off the 10 year average, while November saw -10% and -20% respectively. December wrapped the year on a bright note with sales up 20% over 2024 and right on par with the 10-year-average average.
Bank of Canada
The Bank of Canada’s overnight rate started the year at 3.25% with 0.25% drops in January and again in March bringing the BoC rate down to 2.75% where it stayed until September. Rates came down 0.25% in Sept and again in October bringing the BoC rate down to 2.25% where it finished off the year
The Takeaway
Despite spring headwinds, the North Okanagan market demonstrated resilience. Sales numbers versus the 10-year-average made fairly steady gains after March lows (-28%) and ended the year with sales equaling the 10-year-average in December (a first since March 2022).
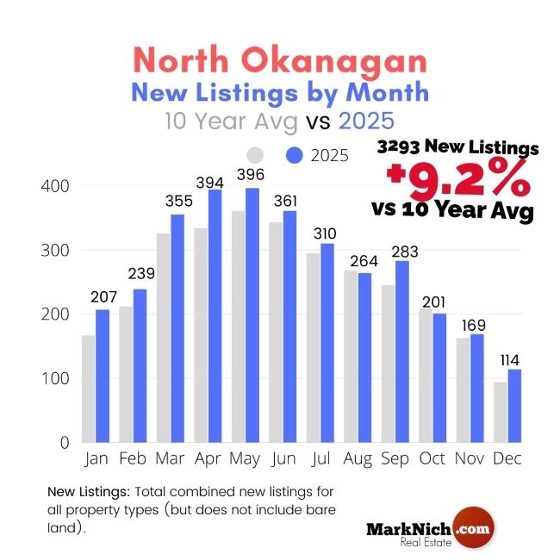
Buyers benefited from interest rate relief and growing inventory through the year, while sellers saw balanced market conditions nine out of 12 months and renewed optimism as sales strengthened through the second half of the year (for the most part).
It may have been a bit of a finicky market for sellers, but with the right pricing strategy homes sold (and often sold quickly).
Compared to many markets around the province - especially Greater Vancouver and the Fraser Valley - the North Okanagan faired quite well.
With slowly growing demand, good inventory levels, and with interest rates predicted to remain steady through 2026 the North Okanagan real estate market looks poised to continue to slowly gain strength. While not a hot real estate year by any means 2025 did show continued growth and ended with stronger sales numbers than 2024 and 2023.