RSS

August Market Snapshot

August Market Update: Wildfires Pause Activity Across the North Okanagan

August real estate activity slowed significantly as forest fires and local evacuations temporarily shifted community priorities away from the market.

North Okanagan Breakdown:

  • Sales: Tumbled 34% year-over-year and finished 37% below the 10-year average, with notable pullbacks across all property types.

  • Listings & Inventory: New listings dropped 21% year-over-year (and 21% below the 10-year average). Single-family inventory felt the largest squeeze, falling 20% year-over-year.

  • Prices: Prices remained steady despite lower volume. The median sales price rose 1.3% year-over-year (though dipped slightly from July). The overall Benchmark Price edged up 0.4% year-over-year, while the single-family Benchmark Price ticked up 0.7% year-over-year—both up slightly from July.

Regional Snapshot:

  • Central Okanagan: Sales fell 9% year-over-year and 25% below the 10-year average.

  • South Okanagan: Sales dropped 35% year-over-year, heavily impacted by fires and evacuations near Summerland.

  • Provincial Benchmark: Across British Columbia, residential sales fell 4.7% year-over-year (25.4% below the 10-year average).

Interest Rates

  • The Bank of Canada held its overnight policy rate at 2.25%. The next rate announcement is October 28.


Looking Ahead: The temporary slowdown has left the market teetering on the fence between a Buyer’s and a Balanced market. As the fire situation cools, expect a modest autumn bounce-back in both sales and listings as sidelined buyers and sellers re-enter the fall market.


Sales

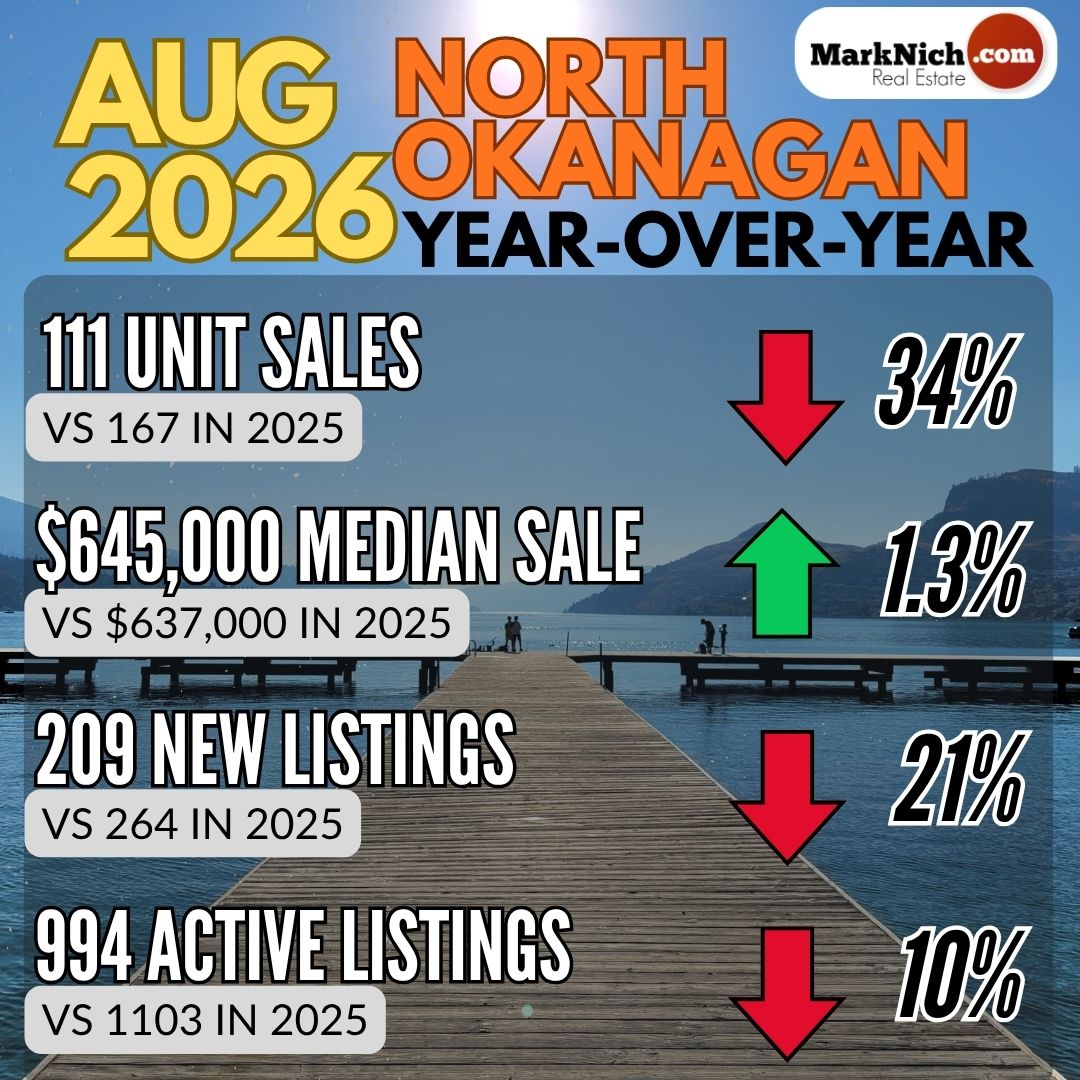
North Okanagan Unit Sales were down 34% Year-over-Year (111 vs 167) and come in 37% below the 10 Year Average (176).  


Median Sales Price

  • Median Selling Price was $645,000, which was up 1.3% Year-over-Year ($637,000), but down from July ($650,000). 


Benchmark Price

  • Single Family Home Benchmark price is $794,300, which is up 0.7% Year-Over-Year and up from July ($782,100)
  • Townhome Benchmark price is $545,900, which down 7.2% Year-over-Year and down from July ($561,000).
  • Condo Benchmark price is $302,400, which is down 3.4% Year-over-Year and down from July ($316,200). 
  • The Overall Composite Benchmark Price for the North Okanagan was down 0.4% Year-over-Year ($680,400 vs $683,000) but up from July ($677,200).


New Listings hitting the market were down 21% Year-over-Year (209 vs 264) which is about 21% below the 10-Year average (263).  New Listings were the lowest totals we have seen over the past 10 years for the month of August.  


Active Listings are down 10%Year-over-Year (994 vs 1103), which puts the North Okanagan about 7% above the 10 year average (931).


The overall North Okanagan straddles the line between a Buyer's Market and a Balanced Market after being close to a Sellers Market in July.

The Sales to Active Listings ratio is 11% (down from 16% in July).
Between 12-25% is considered a Balanced Market.

The Sales to New Listing ratio is 53% (down from 72% in July).
Between 40-60% is considered a Balanced Market. 


Central Okanagan


Unit Sales in the Central Okanagan were down 9% Year-over-Year (327 vs 361), which is 25% below the 10 Year Average of 435.  
 

Benchmark Price 

  • Single Family homes price $1,056,700 which is up 0.2% Year-over-Year but down from July ($1,072,400)
  • Townhome price $698,600 which is down 3.3% Year-over-Year and down from July ($709,500)
  • Condo price is $465,700 which is down 5.5% Year-over-Year and down from July ($490,700)
  • The Overall Composite Benchmark Price for the Central Okanagan was down 0.5% Year-over-Year ($788,000 vs $791,900) and down from July ($804,500)

The chart below shows Benchmark Prices for the Central Okanagan over the past 24 months.


 July saw 712 New Listings hit the market, which is down 17% Year-over-Year (858) and 13% below the 10-Year Average of 823.

And the 2968 current Active Listings is down 11% Year-over-Year (3342).

With a Sales to Active Listings ratio of 11% and Sales to New Listings ratio of 46% the Central Okanagan straddles the line between a Buyers Market and a Balanced Market.  


Okanagan Shuswap Report


British Columbia Report

Housing Market Activity Uneven Across Regions
 

Vancouver, BC – September 14, 2026. The British Columbia Real Estate Association (BCREA) reports that 5,653 residential unit sales were recorded in Multiple Listing Service® (MLS®) Systems in August 2026, down 4.7 per cent from August 2025. The average MLS® residential price in BC in August 2026 was down 1 per cent at $924,826 compared to $925,917 in August 2025.

chart

Total MLS® residential sales dollar volume was $5.2 billion, down 4.8 per cent from the same time the previous year. BC MLS® unit sales were 25.4 per cent lower than the ten-year average for the month of August.

“Provincial home sales remain well below long-term averages but have been steadily improving throughout the year,” said BCREA Chief Economist Brendon Ogmundson. “We expect a gradual recovery in sales to continue, though new tariffs and a recent spike in long-term interest rates add a layer of risk to that scenario.”

Year-to-date, BC residential sales dollar volume is down 6.5 per cent to $43.26 billion, compared with the same period in 2025. Residential unit sales are down 5.5 per cent year-over-year at 46,069 units, while the average MLS® residential price is down 1 per cent to $939,028.

table


Read

July Market Snapshot

Sales and Inventory Drop

Items of Note for July

  • Sales down 5% Year-over-Year and 14% below the 10 Year Average.
  • New Listings down 27% YoY.  
  • Central Okanagan sales Unchanged YoY and only 9% below the 10 Year Avg. 
  • British Columbia residential home sales down 6.7% Year-over-Year, and 18.8% below the 10 Year Avg.
  • Bank of Canada overnight rate at 2.25%.  Next announcement Sept 2


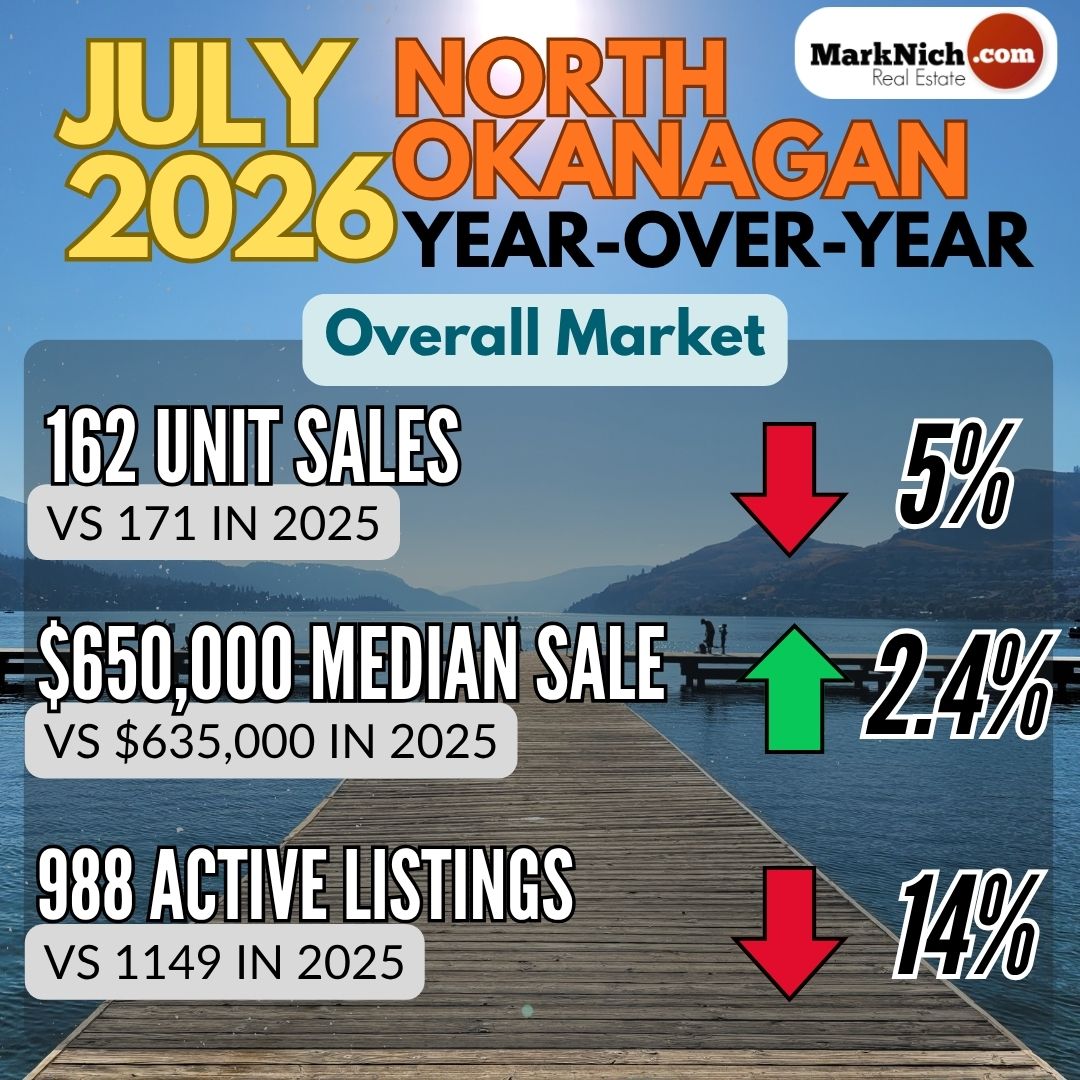
July cooled off somewhat after June's rebound. Unit sales were down 5% year-over-year — 162 versus 171 — and came in 14% below the 10-year average of 189. Median sale price was up 2.4%, to $650,000 from $635,000 last year, so pricing continues to bounce around but not really make any meaningful movement.

The inventory story remains the top story. New listings were down 27% year-over-year — 226 versus 310 — and active listings fell 14%, from 1,149 down to 988. That's a meaningful tightening on top of what was already a scarce market.

If you recall, June saw a real spike in the $1M+ segment — record sales, record share of the market. July didn't repeat it. Sales were down year-over-year over $1M (27 vs. 29). June's surge at the top end looks more like a standout month than the start of a new pattern — which fits what I said at the time: one month doesn't make a trend.

By property type, sales were down almost across the board. Townhomes/triplexes/fourplexes saw the steepest drop — 18 sales versus 30 last year - well below the 10-year average of 31. Single-family home sales were the one bright spot, up year-over-year — 97 versus 90.

Overall, the North Okanagan remains in a balanced market.

Elsewhere in the valley:

Central Okanagan sales were flat year-over-year and came in just 9% below the 10-year average — but the story there was the high end. Sales above $1M jumped to 127 from 100 last year, with similar spikes above $2M, $3M, $4M, and $5M. If June's high-end surge was the North Okanagan’s moment, July was the Central's.

South Okanagan sales declined year-over-year (174 vs. 193), landing 13% below the 10-year average.


Sales

North Okanagan Unit Sales were down 5% Year-over-Year (162 vs 171) and come in 14% below the 10 Year Average (189).  


Median Sales Price

  • Median Selling Price was $650,000, which was up 2.4% Year-over-Year ($635,000), but down from June ($660,900). 


Benchmark Price

  • Single Family Home Benchmark price is $782,100, which is up 1.9% Year-Over-Year but down from June ($784,500)
  • Townhome Benchmark price is $561,000, which up 3.2% Year-over-Year but down from June ($591,600).
  • Condo Benchmark price is $316,200, which is down 0.4% Year-over-Year and down from June ($318,100). 
  • The Overall Composite Benchmark Price for the North Okanagan was up 3% Year-over-Year ($677,200 vs $657,300) and up from June ($684,900).


New Listings hitting the market were down 27% Year-over-Year (226 vs 310) which is about 22% below the 10-Year average (286).  New Listings were the lowest totals we have seen over the past 10 years fr the month of July.  

Active Listings are down 14%Year-over-Year (988 vs 1149), which puts the North Okanagan about 5% above the 10 year average (937) for the month of July.


The overall North Okanagan remains in to a Balanced Market but is pushing closer to a Sellers Market.

The Sales to Active Listings ratio is 16% (down from 18% in June).
Between 12-25% is considered a Balanced Market.

The Sales to New Listing ratio is 72% (up from 66% in June).
Between 40-60% is considered a Balanced Market. 


Central Okanagan


Unit Sales in the Central Okanagan were unchanged Year-over-Year (438 vs 439), which is 9% below the 10 Year Average of 480.  
 

Benchmark Price 

  • Single Family homes price $1,072,400 which is unchanged Year-over-Year and up from June ($1,053,700)
  • Townhome price $709,500 which is down 2.4% Year-over-Year but up from June ($707,500)
  • Condo price is $490,700 which is down 2% Year-over-Year and down from June ($495,100)
  • The Overall Composite Benchmark Price for the Central Okanagan was up 1.6% Year-over-Year ($804,500 vs $791,600) and up from June ($795,600)

The chart below shows Benchmark Prices for the Central Okanagan over the past 24 months.


 July saw 873 New Listings hit the market, which is down 17% Year-over-Year (1047) and 6% below the 10-Year Average of 931.

And the 3066 current Active Listings is down 14% Year-over-Year (3555).

With a Sales to Active Listings ratio of 14% and Sales to New Listings ratio of 50% the Central Okanagan continues to be in a Balanced Market.  


Okanagan Shuswap Report


British Columbia Report

Housing Market Activity Uneven Across Regions
 

Vancouver, BC – August 13, 2026. The British Columbia Real Estate Association (BCREA) reports that 6,561 residential unit sales were recorded in Multiple Listing Service® (MLS®) Systems in July 2026, down 6.7 per cent from July 2025. The average MLS® residential price in BC in July 2026 was down 1.3 per cent at $929,619 compared to $942,247 in July 2025.

chart

Total MLS® residential sales dollar volume was $6.1 billion, down 7.9 per cent from the same time the previous year. BC MLS® unit sales were 18.8 per cent lower than the ten-year average for the month of July.

“Seasonally adjusted sales activity rose from the previous month across most of BC, while weaknesses remained concentrated in the Lower Mainland,” said BCREA Chief Economist Brendon Ogmundson. “Looking ahead, resilience in the economy and a recovering labour market should translate to regional markets converging to long-term averages over the next year.”

Year-to-date, BC residential sales dollar volume is down 6.7 per cent to $38.04 billion, compared with the same period in 2025. Residential unit sales are down 5.6 per cent year-over-year at 40,432 units, while the average MLS® residential price is also down 1.2 per cent to $940,948.

table 
Read

2026 First Half Recap

North Okanagan Market Recap: First Half of 2026

If you've been watching the headlines, you've probably seen the First Half sales numbers were down Year over Year. What you may not have seen is the story underneath them — and it's a little more complex than a simple "market is slowing" narrative.

The Listings Squeeze

Sales through the first half of 2026 were down 4.8% year over year. On its own, that's not a huge surprise in today's environment – wars, tariffs, Trump.  But the more significant shift was on the supply side: new listings have dropped 15.3% over the same period. That's a much steeper decline than sales, and it's already starting to show up in overall inventory, which is now trending down as well.

If that continues, it could change the conversation for both buyers and sellers in the second half of the year.

The $1M+ Market is Quietly Having a Moment

While overall sales slowed, the story at the top of the market moved the other way. Sales of homes priced over $1 million were actually up year over year — 137 sales compared to 118 last year. Meanwhile, sales under $1 million declined, from 677 to 620.

The result: homes over $1 million made up 18.1% of all North Okanagan sales in the first half of 2026 — the highest share on record for any first-half period.

Could Prices Start To Climb

If we look at the Benchmark Selling Price for the overall market in June, prices increased 2% Year over Year.  But the trend over the past 6 months has been increasing after decreasing through the second half of 2025.   And when we look at the Average selling price for all the homes sold during the first half of 2026 vs the first half of 2025 prices increased 6.5%, even with slower sales volume.   So could this be signaling the start of rising prices as we see buyer competition concentrated on a smaller pool of available listings?

What June Might Be Telling Us

So far in 2026, June was the only month with what I'd call decent sales activity so this may be a little premature.  Nonetheless, my thoughts on how this could affect the market moving forward — and I want to be clear this is speculation, not a forecast — is that if the increased sales momentum that showed up in June carries into the second half of the year, and if inventory keeps shrinking the way it has been, we could start to see upward pressure on prices.  That’s a lot of ifs, and there's nothing indicating that it will play out that way, but it's a dynamic worth watching closely.

The Bottom Line

The first half of 2026 wrapped up with a market that's more nuanced than the top-line sales number suggests. Fewer listings, tightening inventory, a resurgent $1M+ segment, and early signs of potential price pressure all point to a market that's shifting shape rather than simply slowing down. That's a shift worth noting, because for the past couple of years this market has been finicky and buyers have been patient. Could this be the first crack in that pattern?

If you're weighing a move in the second half of the year — whether buying, selling, or just trying to figure out what any of this means for your own situation — I'm happy to talk through the specifics.

Reach out.  I’m always happy to talk real estate.


Read

June Market Snapshot

Buyers finally show up but Sellers Continue to Pull Back

Items of Note for June

  • Sales up 5% Year-over-Year and only 7% below the 10 Year Average.
  • Sales above $1,000,000 up 39% YoY
  • New Listings down 22% YoY.  
  • Central Okanagan sales up 10% YoY and only 6.5% below the 10 Year Avg. 
  • British Columbia residential home sales up 0.9% Year-over-Year, but 18.4% below the 10 Year Avg.
  • Bank of Canada keeps overnight rate at 2.25%. 


June told two very different stories depending on price point. New listings continued their year-long slide, down 22% year-over-year and the lowest for any June in the past decade. Active listings followed suit, down 11% YoY. But sales rebounded — up 5% year-over-year and only 7% below the 10-year average, a real shift after seeing sales range between 21-26% below the 10 year average between Feb and May..

Sales under $1M actually dipped slightly (147 vs. 150), with every property type seeing fewer sales year-over-year. For the single family home segment Inventory tightened even further — pushing the sales to active listings ratio to 24% and the sales-to-new-listings ratio to 79%, the highest we've seen since the first half of 2023.  This is edging close to seller's market territory. Yet prices under $1M still aren't moving. Buyers are staying disciplined: homes priced accurately are moving fast, while overpriced listings are sitting untouched.

Above $1M, June was a different world entirely. Sales hit 39 — tying the all-time monthly record — and made up 21% of all sales in the North Okanagan, the highest share on record. Every tier from $1M+ to $3M+ either matched or set a new high. My take: sellers at this price point have adjusted prices to meet the market, and buyers are recognizing the value, especially when compared to similar properties in Kelowna.

Looking around the rest of the Okanagan, the Central Okanagan saw sales up 10% year-over-year and only 6.5% below the 10 year average, while in the South Okanagan sales were flat,(but this follows a very strong month of May that saw sales almost 6% above the 10 year average).. Both markets saw flat benchmark pricing YoY and are seeing the same inventory squeeze that the north Okanagan is..


Sales

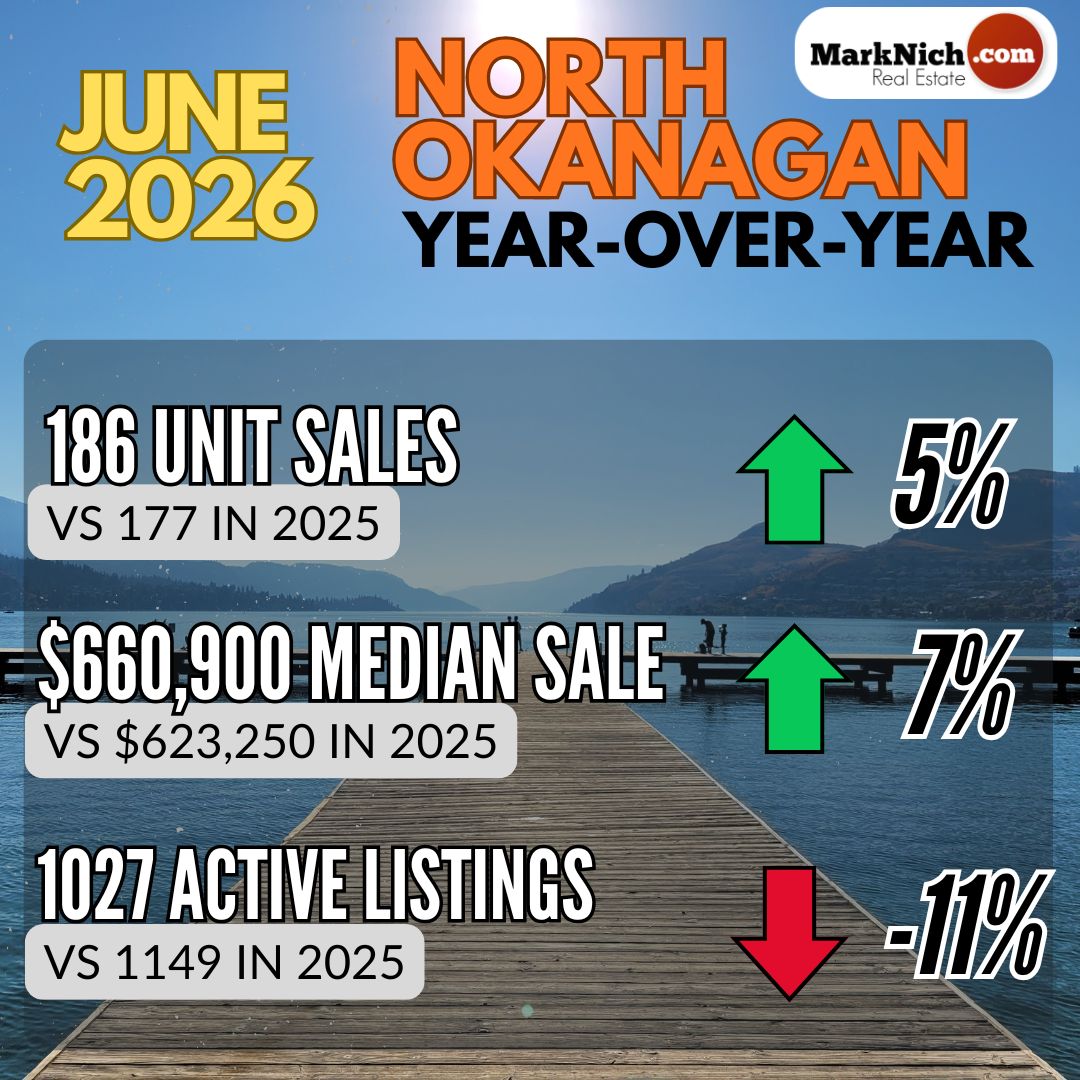
North Okanagan Unit Sales were up 5% Year-over-Year (186 vs 177) and come in just 7% below the 10 Year Average (200).  
Sales of properties above $1M have record breaking month:

  • 39 sales above $1M ties highest total ever
  • 14 sales above $1.5M highest ever
  • 7 sales above $2M tied for 2nde highest ever
  • 4 sales above $3M highest ever


Median Sales Price

  • Median Selling Price was $660,900, which was up 6% Year-over-Year ($623,250), and up from May ($646,000). 


Benchmark Price

  • Single Family Home Benchmark price is $784,500, which is up 0.4% Year-Over-Year and up from May($756,900)
  • Townhome Benchmark price is $591,600, which up 5.1% Year-over-Year and up May ($567,100).
  • Condo Benchmark price is $318,100, which is down 2.2% Year-over-Year and down from May ($322,100). 
  • The Overall Composite Benchmark Price for the North Okanagan was up 2% Year-over-Year ($684,900 vs $671,200) and up from May ($661,500).


New Listings hitting the market were down 22% Year-over-Year (281 vs 361) which is about 22% below the 10-Year average (336).  New Listings were the lowest totals we have seen over the past 10 years fr the month of June.  

Active Listings are down 11%Year-over-Year (1027 vs 1149), which puts the North Okanagan about 10% above the 10 year average (934) for the month of June.


The overall North Okanagan remains in to a Balanced Market but is pushing closer to a Sellers Market.

The Sales to Active Listings ratio is 18% (up from 15% in May).
Between 12-25% is considered a Balanced Market.

The Sales to New Listing ratio is 66% (up from 49% in May).
Between 40-60% is considered a Balanced Market. 


Central Okanagan


Unit Sales in the Central Okanagan were up 10% Year-over-Year (458 vs 417), which is 6.5% below the 10 Year Average of 490.  
 

Benchmark Price 

  • Single Family homes price $1,053,700 which is down 1.6% Year-over-Year and down from May ($1,062,800)
  • Townhome price $707,500 which is down 0.9% Year-over-Year and down from May ($732,400)
  • Condo price is $495,100 which is down 3.4% Year-over-Year and down from May ($498,200)
  • The Overall Composite Benchmark Price for the Central Okanagan was down 0.6% Year-over-Year ($795,600 vs $800,300) and unchanged from May ($796,600)

The chart below shows Benchmark Prices for the Central Okanagan over the past 24 months.


 June saw 986 New Listings hit the market, which is down 13% Year-over-Year (1130) and 16% below the 10-Year Average of 1074.

And the 3195 current Active Listings is down 11% Year-over-Year (3473).

With a Sales to Active Listings ratio of 14% and Sales to New Listings ratio of 46% the Central Okanagan continues to be in a Balanced Market.  


Okanagan Shuswap Report


British Columbia Report

Market Activity Shows Encouraging Signs of Improvement
 

Vancouver, BC – July 13, 2026. The British Columbia Real Estate Association (BCREA) reports that 7,225 residential unit sales were recorded in Multiple Listing Service® (MLS®) Systems in June 2026, up 0.9 per cent from June 2025. The average MLS® residential price in BC in June 2026 was down 0.8 per cent at $946,878 compared to $954,712 in June 2025.

chart

Total MLS® residential sales dollar volume was $6.84 billion, up 0.1 per cent from the same time the previous year. BC MLS® unit sales were 18.4 per cent lower than the ten-year average for the month of June.

“Sales rose year-over-year in June for the first time since September 2025, driven by stronger activity in the Greater Vancouver area,” said BCREA Chief Economist Brendon Ogmundson. “We hope this marks the beginning of a stronger second half of the year across BC housing markets as sales converge to more normal levels following several years of unexpected global shocks.”

Year-to-date, BC residential sales dollar volume is down 6.4 per cent to $31.96 billion, compared with the same period in 2025. Residential unit sales are down 5.4 per cent year-over-year at 33,886 units, while the average MLS® residential price is also down 1.1 per cent to $943,249.

table
Read
The trademarks REALTOR®, REALTORS®, and the REALTOR® logo are controlled by The Canadian Real Estate Association (CREA) and identify real estate professionals who are member’s of CREA. The trademarks MLS®, Multiple Listing Service® and the associated logos are owned by CREA and identify the quality of services provided by real estate professionals who are members of CREA. Used under license.