August Market Update: Wildfires Pause Activity Across the North Okanagan
August real estate activity slowed significantly as forest fires and local evacuations temporarily shifted community priorities away from the market.
North Okanagan Breakdown:
-
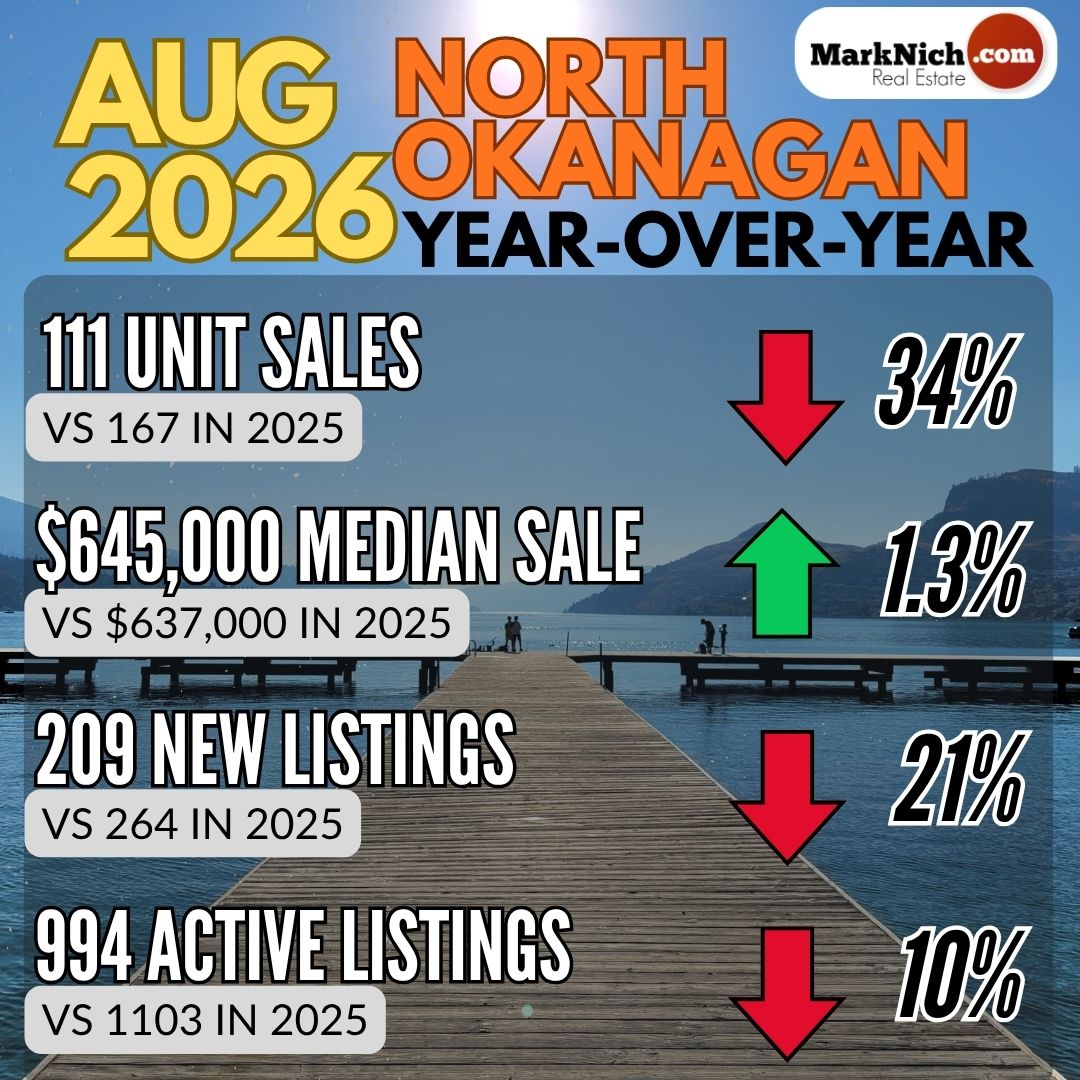
Sales: Tumbled 34% year-over-year and finished 37% below the 10-year average, with notable pullbacks across all property types.
-
Listings & Inventory: New listings dropped 21% year-over-year (and 21% below the 10-year average). Single-family inventory felt the largest squeeze, falling 20% year-over-year.
-
Prices: Prices remained steady despite lower volume. The median sales price rose 1.3% year-over-year (though dipped slightly from July). The overall Benchmark Price edged up 0.4% year-over-year, while the single-family Benchmark Price ticked up 0.7% year-over-year—both up slightly from July.
Regional Snapshot:
-
Central Okanagan: Sales fell 9% year-over-year and 25% below the 10-year average.
-
South Okanagan: Sales dropped 35% year-over-year, heavily impacted by fires and evacuations near Summerland.
-
Provincial Benchmark: Across British Columbia, residential sales fell 4.7% year-over-year (25.4% below the 10-year average).
Interest Rates
- The Bank of Canada held its overnight policy rate at 2.25%. The next rate announcement is October 28.
Looking Ahead: The temporary slowdown has left the market teetering on the fence between a Buyer’s and a Balanced market. As the fire situation cools, expect a modest autumn bounce-back in both sales and listings as sidelined buyers and sellers re-enter the fall market.
Sales
North Okanagan Unit Sales were down 34% Year-over-Year (111 vs 167) and come in 37% below the 10 Year Average (176).

Median Sales Price
- Median Selling Price was $645,000, which was up 1.3% Year-over-Year ($637,000), but down from July ($650,000).

Benchmark Price
- Single Family Home Benchmark price is $794,300, which is up 0.7% Year-Over-Year and up from July ($782,100)
- Townhome Benchmark price is $545,900, which down 7.2% Year-over-Year and down from July ($561,000).
- Condo Benchmark price is $302,400, which is down 3.4% Year-over-Year and down from July ($316,200).
- The Overall Composite Benchmark Price for the North Okanagan was down 0.4% Year-over-Year ($680,400 vs $683,000) but up from July ($677,200).

New Listings hitting the market were down 21% Year-over-Year (209 vs 264) which is about 21% below the 10-Year average (263). New Listings were the lowest totals we have seen over the past 10 years for the month of August.

Active Listings are down 10%Year-over-Year (994 vs 1103), which puts the North Okanagan about 7% above the 10 year average (931).


The overall North Okanagan straddles the line between a Buyer's Market and a Balanced Market after being close to a Sellers Market in July.
The Sales to Active Listings ratio is 11% (down from 16% in July).
Between 12-25% is considered a Balanced Market.
The Sales to New Listing ratio is 53% (down from 72% in July).
Between 40-60% is considered a Balanced Market.
Central Okanagan
Unit Sales in the Central Okanagan were down 9% Year-over-Year (327 vs 361), which is 25% below the 10 Year Average of 435.
Benchmark Price
- Single Family homes price $1,056,700 which is up 0.2% Year-over-Year but down from July ($1,072,400)
- Townhome price $698,600 which is down 3.3% Year-over-Year and down from July ($709,500)
- Condo price is $465,700 which is down 5.5% Year-over-Year and down from July ($490,700)
- The Overall Composite Benchmark Price for the Central Okanagan was down 0.5% Year-over-Year ($788,000 vs $791,900) and down from July ($804,500)
The chart below shows Benchmark Prices for the Central Okanagan over the past 24 months.

July saw 712 New Listings hit the market, which is down 17% Year-over-Year (858) and 13% below the 10-Year Average of 823.
And the 2968 current Active Listings is down 11% Year-over-Year (3342).
With a Sales to Active Listings ratio of 11% and Sales to New Listings ratio of 46% the Central Okanagan straddles the line between a Buyers Market and a Balanced Market.
|





Comments:
Post Your Comment: