Sales and Inventory Drop
Items of Note for July
- Sales down 5% Year-over-Year and 14% below the 10 Year Average.
- New Listings down 27% YoY.
- Central Okanagan sales Unchanged YoY and only 9% below the 10 Year Avg.
- British Columbia residential home sales down 6.7% Year-over-Year, and 18.8% below the 10 Year Avg.
- Bank of Canada overnight rate at 2.25%. Next announcement Sept 2
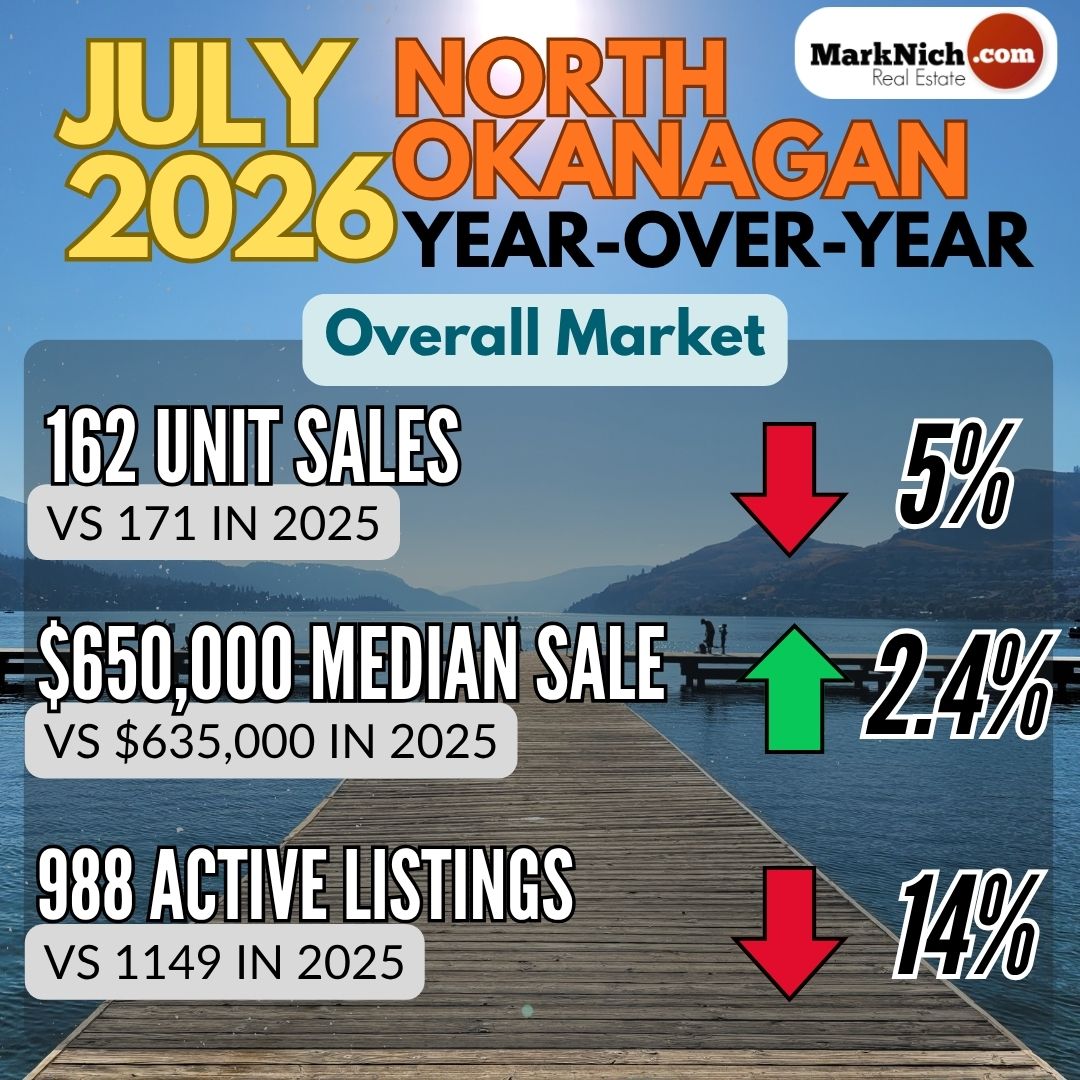
July cooled off somewhat after June's rebound. Unit sales were down 5% year-over-year — 162 versus 171 — and came in 14% below the 10-year average of 189. Median sale price was up 2.4%, to $650,000 from $635,000 last year, so pricing continues to bounce around but not really make any meaningful movement.
The inventory story remains the top story. New listings were down 27% year-over-year — 226 versus 310 — and active listings fell 14%, from 1,149 down to 988. That's a meaningful tightening on top of what was already a scarce market.
If you recall, June saw a real spike in the $1M+ segment — record sales, record share of the market. July didn't repeat it. Sales were down year-over-year over $1M (27 vs. 29). June's surge at the top end looks more like a standout month than the start of a new pattern — which fits what I said at the time: one month doesn't make a trend.
By property type, sales were down almost across the board. Townhomes/triplexes/fourplexes saw the steepest drop — 18 sales versus 30 last year - well below the 10-year average of 31. Single-family home sales were the one bright spot, up year-over-year — 97 versus 90.
Overall, the North Okanagan remains in a balanced market.
Elsewhere in the valley:
Central Okanagan sales were flat year-over-year and came in just 9% below the 10-year average — but the story there was the high end. Sales above $1M jumped to 127 from 100 last year, with similar spikes above $2M, $3M, $4M, and $5M. If June's high-end surge was the North Okanagan’s moment, July was the Central's.
South Okanagan sales declined year-over-year (174 vs. 193), landing 13% below the 10-year average.
Sales
North Okanagan Unit Sales were down 5% Year-over-Year (162 vs 171) and come in 14% below the 10 Year Average (189).

Median Sales Price
- Median Selling Price was $650,000, which was up 2.4% Year-over-Year ($635,000), but down from June ($660,900).

Benchmark Price
- Single Family Home Benchmark price is $782,100, which is up 1.9% Year-Over-Year but down from June ($784,500)
- Townhome Benchmark price is $561,000, which up 3.2% Year-over-Year but down from June ($591,600).
- Condo Benchmark price is $316,200, which is down 0.4% Year-over-Year and down from June ($318,100).
- The Overall Composite Benchmark Price for the North Okanagan was up 3% Year-over-Year ($677,200 vs $657,300) and up from June ($684,900).

New Listings hitting the market were down 27% Year-over-Year (226 vs 310) which is about 22% below the 10-Year average (286). New Listings were the lowest totals we have seen over the past 10 years fr the month of July.
Active Listings are down 14%Year-over-Year (988 vs 1149), which puts the North Okanagan about 5% above the 10 year average (937) for the month of July.


The overall North Okanagan remains in to a Balanced Market but is pushing closer to a Sellers Market.
The Sales to Active Listings ratio is 16% (down from 18% in June).
Between 12-25% is considered a Balanced Market.
The Sales to New Listing ratio is 72% (up from 66% in June).
Between 40-60% is considered a Balanced Market.
Central Okanagan
Unit Sales in the Central Okanagan were unchanged Year-over-Year (438 vs 439), which is 9% below the 10 Year Average of 480.
Benchmark Price
- Single Family homes price $1,072,400 which is unchanged Year-over-Year and up from June ($1,053,700)
- Townhome price $709,500 which is down 2.4% Year-over-Year but up from June ($707,500)
- Condo price is $490,700 which is down 2% Year-over-Year and down from June ($495,100)
- The Overall Composite Benchmark Price for the Central Okanagan was up 1.6% Year-over-Year ($804,500 vs $791,600) and up from June ($795,600)
The chart below shows Benchmark Prices for the Central Okanagan over the past 24 months.

July saw 873 New Listings hit the market, which is down 17% Year-over-Year (1047) and 6% below the 10-Year Average of 931.
And the 3066 current Active Listings is down 14% Year-over-Year (3555).
With a Sales to Active Listings ratio of 14% and Sales to New Listings ratio of 50% the Central Okanagan continues to be in a Balanced Market.
|





Comments:
Post Your Comment: