Buyers finally show up but Sellers Continue to Pull Back
Items of Note for June
- Sales up 5% Year-over-Year and only 7% below the 10 Year Average.
- Sales above $1,000,000 up 39% YoY
- New Listings down 22% YoY.
- Central Okanagan sales up 10% YoY and only 6.5% below the 10 Year Avg.
- British Columbia residential home sales up 0.9% Year-over-Year, but 18.4% below the 10 Year Avg.
- Bank of Canada keeps overnight rate at 2.25%.
June told two very different stories depending on price point. New listings continued their year-long slide, down 22% year-over-year and the lowest for any June in the past decade. Active listings followed suit, down 11% YoY. But sales rebounded — up 5% year-over-year and only 7% below the 10-year average, a real shift after seeing sales range between 21-26% below the 10 year average between Feb and May..
Sales under $1M actually dipped slightly (147 vs. 150), with every property type seeing fewer sales year-over-year. For the single family home segment Inventory tightened even further — pushing the sales to active listings ratio to 24% and the sales-to-new-listings ratio to 79%, the highest we've seen since the first half of 2023. This is edging close to seller's market territory. Yet prices under $1M still aren't moving. Buyers are staying disciplined: homes priced accurately are moving fast, while overpriced listings are sitting untouched.
Above $1M, June was a different world entirely. Sales hit 39 — tying the all-time monthly record — and made up 21% of all sales in the North Okanagan, the highest share on record. Every tier from $1M+ to $3M+ either matched or set a new high. My take: sellers at this price point have adjusted prices to meet the market, and buyers are recognizing the value, especially when compared to similar properties in Kelowna.
Looking around the rest of the Okanagan, the Central Okanagan saw sales up 10% year-over-year and only 6.5% below the 10 year average, while in the South Okanagan sales were flat,(but this follows a very strong month of May that saw sales almost 6% above the 10 year average).. Both markets saw flat benchmark pricing YoY and are seeing the same inventory squeeze that the north Okanagan is..
Sales
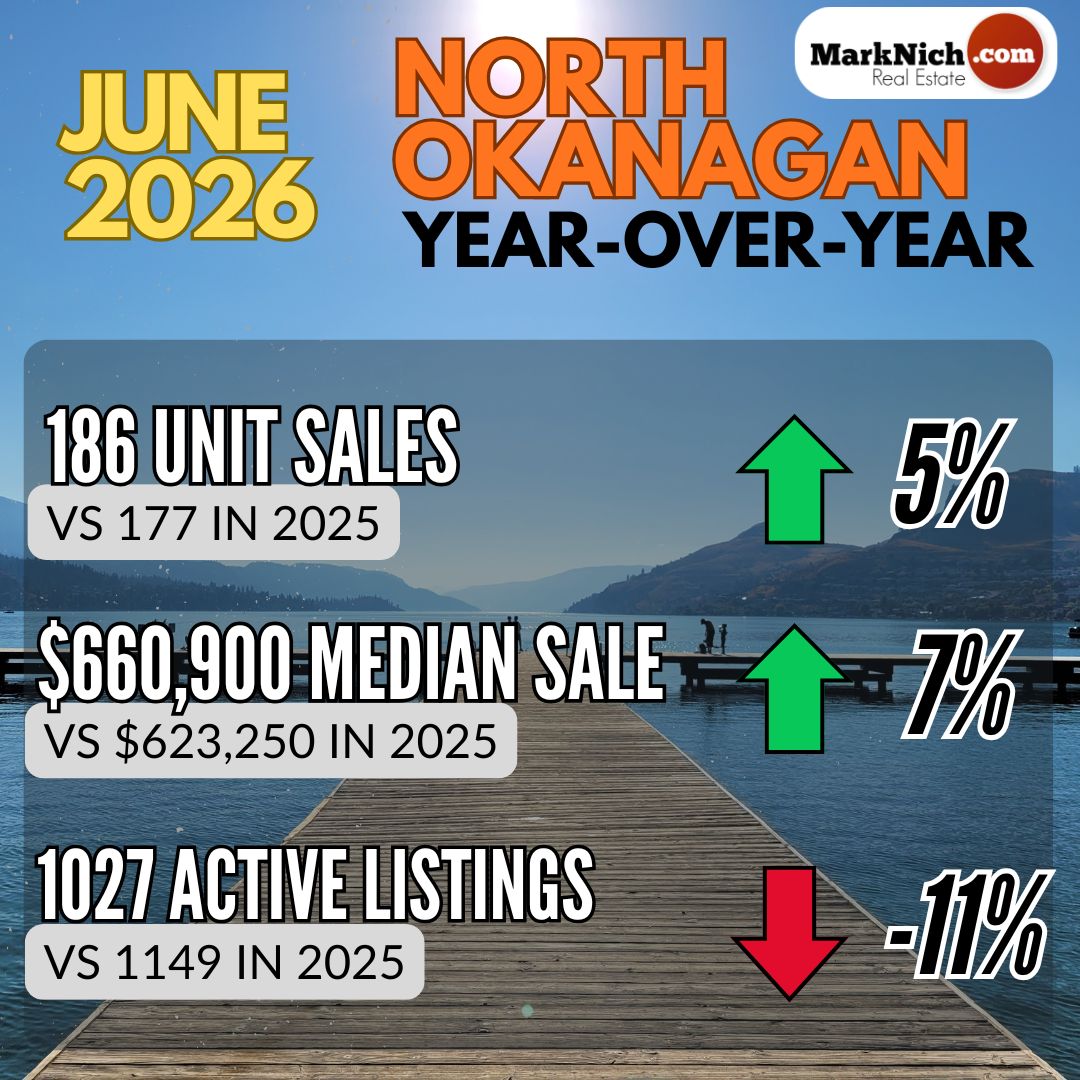
North Okanagan Unit Sales were up 5% Year-over-Year (186 vs 177) and come in just 7% below the 10 Year Average (200).
Sales of properties above $1M have record breaking month:
- 39 sales above $1M ties highest total ever
- 14 sales above $1.5M highest ever
- 7 sales above $2M tied for 2nde highest ever
- 4 sales above $3M highest ever

Median Sales Price
- Median Selling Price was $660,900, which was up 6% Year-over-Year ($623,250), and up from May ($646,000).

Benchmark Price
- Single Family Home Benchmark price is $784,500, which is up 0.4% Year-Over-Year and up from May($756,900)
- Townhome Benchmark price is $591,600, which up 5.1% Year-over-Year and up May ($567,100).
- Condo Benchmark price is $318,100, which is down 2.2% Year-over-Year and down from May ($322,100).
- The Overall Composite Benchmark Price for the North Okanagan was up 2% Year-over-Year ($684,900 vs $671,200) and up from May ($661,500).

New Listings hitting the market were down 22% Year-over-Year (281 vs 361) which is about 22% below the 10-Year average (336). New Listings were the lowest totals we have seen over the past 10 years fr the month of June.
Active Listings are down 11%Year-over-Year (1027 vs 1149), which puts the North Okanagan about 10% above the 10 year average (934) for the month of June.


The overall North Okanagan remains in to a Balanced Market but is pushing closer to a Sellers Market.
The Sales to Active Listings ratio is 18% (up from 15% in May).
Between 12-25% is considered a Balanced Market.
The Sales to New Listing ratio is 66% (up from 49% in May).
Between 40-60% is considered a Balanced Market.
Central Okanagan
Unit Sales in the Central Okanagan were up 10% Year-over-Year (458 vs 417), which is 6.5% below the 10 Year Average of 490.
Benchmark Price
- Single Family homes price $1,053,700 which is down 1.6% Year-over-Year and down from May ($1,062,800)
- Townhome price $707,500 which is down 0.9% Year-over-Year and down from May ($732,400)
- Condo price is $495,100 which is down 3.4% Year-over-Year and down from May ($498,200)
- The Overall Composite Benchmark Price for the Central Okanagan was down 0.6% Year-over-Year ($795,600 vs $800,300) and unchanged from May ($796,600)
The chart below shows Benchmark Prices for the Central Okanagan over the past 24 months.

June saw 986 New Listings hit the market, which is down 13% Year-over-Year (1130) and 16% below the 10-Year Average of 1074.
And the 3195 current Active Listings is down 11% Year-over-Year (3473).
With a Sales to Active Listings ratio of 14% and Sales to New Listings ratio of 46% the Central Okanagan continues to be in a Balanced Market.
|





Comments:
Post Your Comment: