A Cautious Start to Spring
Items of Note for March
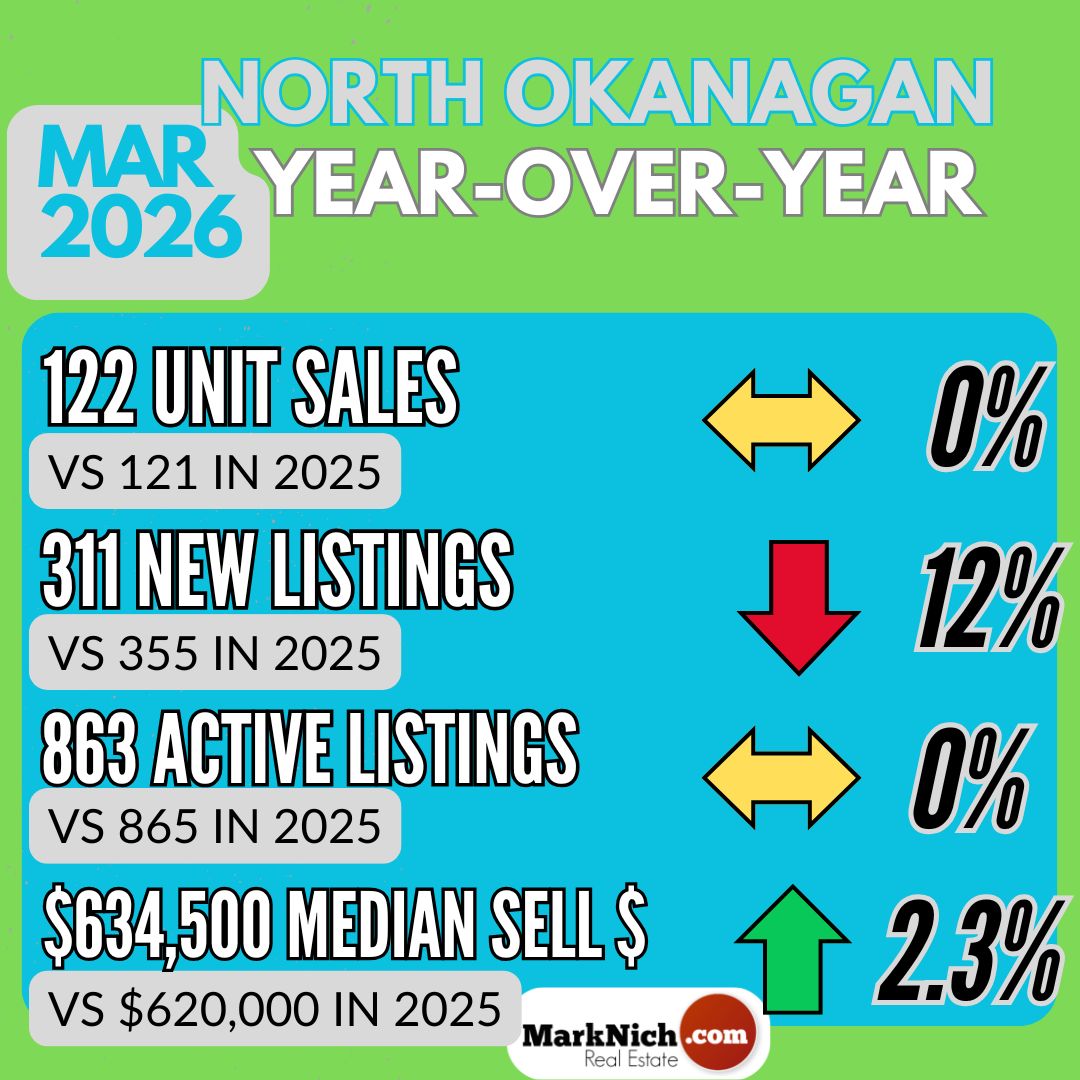
- North Okanagan Year-over-Year sales unchanged Year-over-Year
- Sales 26% below the 10 Year Average for the second month in a row
- North Okanagan on the fence between a Buyer's and Balanced Market
- Central Okanagan sales up 6% Year-over-Year but still 22% below the 10 Year Average
- British Columbia residential home sales down 9.7% Year-over-Year
- Next Bank of Canada rate announcement April 29
North Okanagan sales held steady year-over-year but remain 26% below the 10-year average — a reflection of the cautious tone that has defined the market heading into spring. Prices followed a similar pattern: the median selling price edged up 2.3% year-over-year, while benchmark prices dipped slightly across all property types.
On the supply side, new listings were down 12% year-over-year but are tracking close to the 10-year average. Total active inventory is essentially unchanged from last year and sits roughly 20% above the long-term average — meaning buyers have options, but sellers aren't flooding the market either.
The mood right now is measured on both sides. Homes priced correctly are still moving quickly at any price point. Those sitting longer are generally seeing price reductions before attracting offers. With ongoing uncertainty — both domestically and globally — there's no strong sense of urgency from buyers or sellers, and the data reflects that.
Sales
North Okanagan Unit Sales were unchanged Year-over-Year (122 vs 121) and come in 26% below the 10 Year Average (164).


Median Sales Price
- Median Selling Price was $634,500, which was up 2% Year-over-Year ($620,000), but down from Feb ($644,000).

North Okanagan Median Selling Price since 2022 peak.

Benchmark Price
- Single Family Home Benchmark price is $761,700, which is down 1.1% Year-Over-Year and down from Feb ($781,200)
- Townhome Benchmark price is $548,900, which down 4.0% Year-over-Year but unchanged from Feb ($546,000).
- Condo Benchmark price is $303,900, which is down 4.8% Year-over-Year and unchanged from Feb ($303,500).
- The Overall Composite Benchmark Price for the North Okanagan was down 1.6% Year-over-Year ($656,400 vs $666,800) and down from Feb ($667,800).

Benchmark Selling Prices for the North Okanagan since the peak of the market March 2022.

New Listings hitting the market were down 12% Year-over-Year (311 vs 355) which is about 3% below the 10-Year average (322).
Active Listings are unchanged Year-over-Year (863 vs 865), which puts the North Okanagan about 20% above the 10 year average (722) for the month of March.


The overall North Okanagan market continues to straddle the fence between a Balanced Market and a Buyer's Market.
The Sales to Active Listings ratio is 14% (up from 11.7% in Feb).
Between 12-25% is considered a Balanced Market.
The Sales to New Listing ratio is 39% (unchanged from Feb).
Between 40-60% is considered a Balanced Market.
Days to Sell Average is 85 days. This is up Year-over-Year (64) but down sightly from Feb (86).
Central Okanagan
Unit Sales in the Central Okanagan for January were up 6% Year-over-Year (364 vs 343), which is 22% below the 10 Year Average of 476.
Benchmark Price
- Single Family homes price $1,047,900 which is down 2.3% Year-over-Year and down from February ($1,056,600)
- Townhome price $725,500 which is down 3.4% Year-over-Year but up from February ($671,300)
- Condo price is $471,800 which is down 5.7% Year-over-Year but unchanged from February ($472,000)
- The Overall Composite Benchmark Price for the Central Okanagan was down 2.6% Year-over-Year ($777,500 vs $797,900) and down from January ($791,000)
The chart below shows Benchmark Prices for the Central Okanagan over the past 12 months.

March saw 1058 New Listings hit the market, which is down 11% Year-over-Year (1186) and 3% above the 10-Year Average of 1030.
And the 2798 current Active Listings is down 10% Year-over-Year (3097) and is 34% above the 10-year average of 2081.
With a Sales to Active Listings ratio of 13% and Sales to New Listings ratio of 34% the Central Okanagan straddles the line between a Buyer's Market and a balanced market.
|
|
Local Residential Real Estate Market Activity Picks Up Heading into Spring
KELOWNA, B.C. – April 7, 2026 Residential real estate activity in March showed signs of gaining momentum ahead of the spring market, reports the Association of Interior REALTORS® (the Association).
A total of 1,154 residential unit sales were recorded across the Association region in March, up from February’s 838 units, and up 1.3% compared to units sold in March 2025.
New residential listings saw a 4.8% decrease compared to March 2025 with 3,059 new listings recorded last month, yet up from the previous month’s 2,235 new listings. The total number of active listings saw a 3.1% decrease in inventory compared to March 2025 with 8,112 recorded across the Association region. The highest percentage increase in active listings across the Association region was recorded in the Kamloops and District region with a total increase of 4% compared to March last year.
“Although sales are still trailing the 10-year average, recent sales activity is a positive sign as we head into the typically busy spring market. We’re seeing improvement from earlier in the year, even as inventory edges down slightly compared to the same time last year, which is likely a reflection of economic uncertainty continuing to temper some consumer confidence,” says Association of Interior REALTORS® President Kadin Rainville, adding that “in this environment, strategic pricing is essential to capture buyer attention and maximize results.”
In the Okanagan and Shuswap/Revelstoke regions, the benchmark price for single-family homes saw decreases last month in all sub-areas in year-over-year comparisons, with the highest percentage decrease of 7.8% recorded in the South Okanagan, coming in at $709,900. The townhome housing category similarly saw percentage decreases in all sub-areas, with the Shuswap/Revelstoke region seeing the highest percentage decrease of 4.1% compared to the same time the previous year, coming in at $536,800. The benchmark price in the condominium housing category saw decreases in all sub-regions compared to March 2025 with the exception of the South Okanagan that saw an increase of 1%, coming in at $425,800.
Given the high stakes on such a significant financial transaction, home sellers and buyers can benefit from the knowledge and skills of a practiced REALTOR®. Contact your local REALTOR® Mark Nichiporuk to find out more about the real estate market and how I can help you achieve your real estate goals.
|
|
|
Market Activity Flounders Througout the Province
Vancouver, BC – March 12, 2026. The British Columbia Real Estate Association (BCREA) reports that 4,516 residential unit sales were recorded in Multiple Listing Service® (MLS®) Systems in February 2026, down 9.7 per cent from February 2025. The average MLS® residential price in BC in February 2026 was down 2.9 per cent at $932,243 compared to $960,572 in February 2025.

Total MLS® residential sales dollar volume was $4.21 billion, down 12.3 per cent from the same time the previous year. BC MLS® unit sales were 32.87 per cent lower than the ten-year average for the month of February.
“Housing market activity continues to struggle, with sales declining from every region in the province compared to the same time last year,” said BCREA Chief Economist Brendon Ogmundson. “We hope that improved affordability conditions in most regions and stable rates will motivate prospective demand to enter the market and drive stronger sales activity over the rest of the year.”
Year-to-date, BC residential sales dollar volume is down 17.8 per cent to $7.3 billion, compared with the same period in 2025. Residential unit sales are down 15.8 per cent year-over-year at 7,832 units, while the average MLS® residential price is also down 2.4 per cent to $929,323.
 |
|
|


Comments:
Post Your Comment: