The Market Slows Down for the Holidays Early in the North Okanagan
Items of Note for November
- North Okanagan Year-over-Year sales down 10%. Since November 2023 there have only been two months that experienced Year-over-Year sales declines (May being the other one).
- Sales take a another step back against the 10 Year Average. November sales in the North Okanagan come in 20% below the 10 Year Average - this is after September sales figures came in just 3.7% below the 10 Year Average.
- Central Okanagan sales down 8% Year-over-Year and 25% below the 10 Year Average
- British Columbia residential home sales down 13% Year-over-Year.
- Bank of Canada holds overnight rate at 2.25% .
Sales
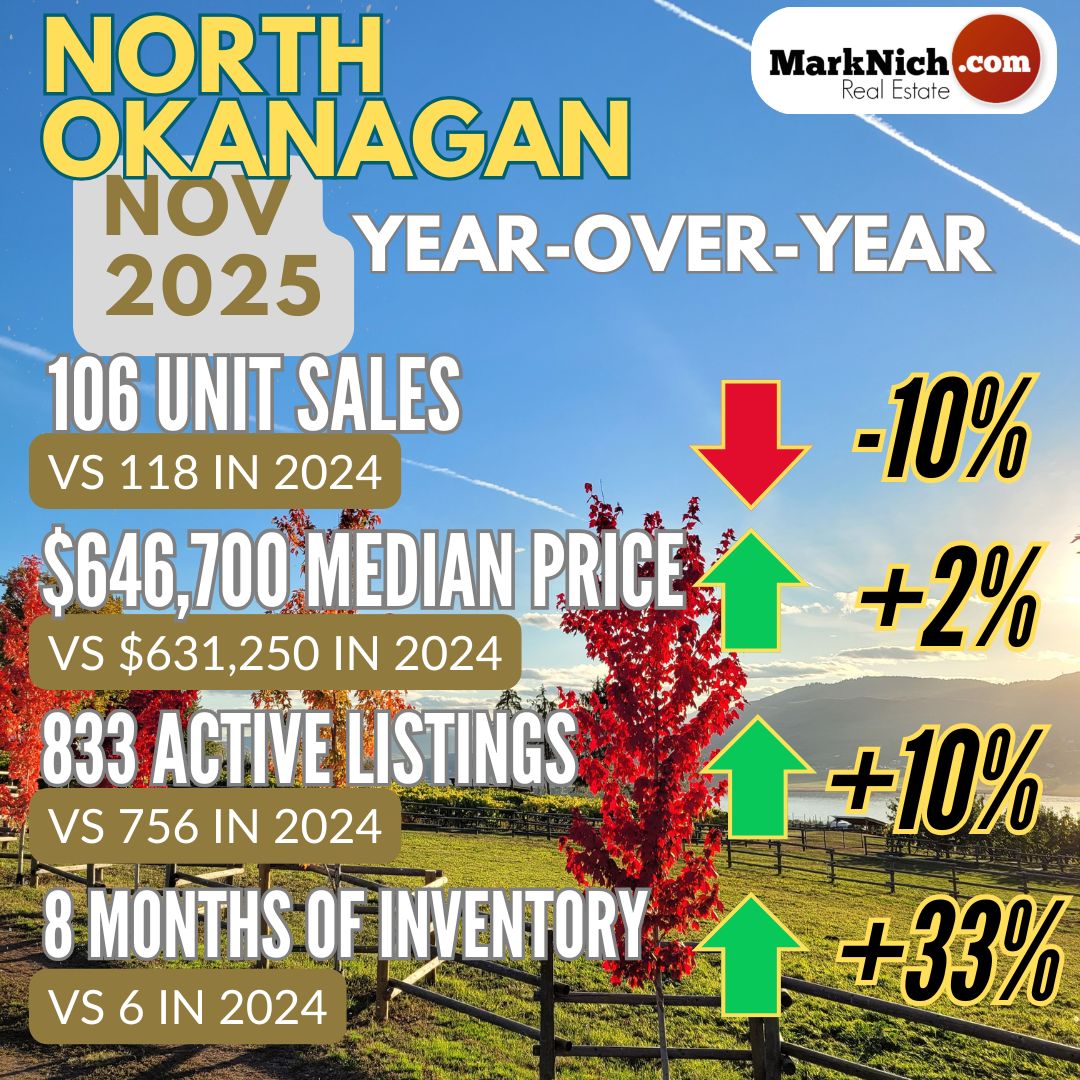
North Okanagan Unit Sales were down 10% Year-over-Year (106 vs 118) which is 20% below the 10 Year Average of 132. 


Median Sales Price
- Median Selling Price was $646,700, which was up 2% Year-over-Year ($631,25000), and up from Oct ($624,500).
Average Sales Price
- Average Selling Price was $679,689, which is unchanged Year-over-Year ($676,520), but down from Oct ($709,393).

Benchmark Price
- Single Family Home Benchmark price is $739,400, which is down 3% Year-Over-Year and also down from October ($773,400)
- Townhome Benchmark price is $557,600, which down 7% Year-over-Year and down from October ($570,300).
- Condo Benchmark price is $309,800, which is up 1% Year-over-Year and but down from October ($314,800).
- The Overall Composite Benchmark Price for the North Okanagan was down Year-over-Year ($644,800 vs $664,700) and unchanged from October ($646,200).

Composite Benchmark Selling Price for the North Okanagan since March 2020. 
New Listings hitting the market were up 6% Year-over-Year (169 vs 160) which is about 4% above the 10-Year average (163).
Active Listings are up 10% Year-over-Year (833 vs 756), which puts the North Okanagan about 17% above the 10 year average (713) for the month of November.

The overall North Okanagan market continues to be in a balanced market.
The Sales to Active Listings ratio is 13% (down from 16% in Octoberr, 15% in Sept, Aug, July, June and May).
Between 12-25% is considered a Balanced Market.
The Sales to New Listing ratio is 63% (down from 74% in October).
Between 40-60% is considered a Balanced Market.
Days to Sell Average is 81 days. This is up Year-over-Year (76) and up from October (79).
For the full report click here


Comments:
Post Your Comment: