Market Rebounds From August Fires but Remains Quiet
September real estate activity saw a rebound from August numbers as buyers and sellers returned post-wildfires, though overall transaction volume continues to mirror the slower, below-average pace seen throughout 2026.
North Okanagan Breakdown:
-
Sales: Rebounded sharply compared to August's fire-impacted low (which saw a 34% YoY drop). While September sales might seem underwhelming, coming in 17% below last year’s numbers, context is key: September 2025 was a very strong month—finishing just 3.7% below the 10-year average.
-
Listings & Inventory: New listings fell 22% year-over-year (and 9% below the 10-year average). Active listings fell 11% YoY and sit just 5% above the 10-year average, keeping overall inventory relatively tight.
-
Prices: Values remain resilient despite lower sales volume. The median sales price rose 2.3% year-over-year (though down 1.5% from August). The overall Benchmark Price is up 4.9% year-over-year, while the Single-Family Benchmark Price rose 5.6% year-over-year.
Regional Snapshot:
-
Central Okanagan: Sales fell 13% year-over-year and 21% below the 10-year average.
-
South Okanagan: Sales dropped 22% year-over-year and finished 32% below the 10-year average.
-
Provincial Benchmark: Across British Columbia, residential sales were down 8.9% year-to-date and 25.8% below the 10-year average.
Interest Rates:
Looking Ahead:
While September brought a clear bounce-back from August's wildfire disruptions, overall activity remains historically muted—much like we have seen all year. September sales came in 17% below the 10-Year Average and Year-to-Date sales sit 10% below 2025 levels (though up slightly from 2024’s 10-year lows).
However, with both Sales-to-New-Listings and Sales-to-Active-Listings ratios rising over August, the North Okanagan market has shifted solidly into Balanced market territory heading into the final quarter.
Sales
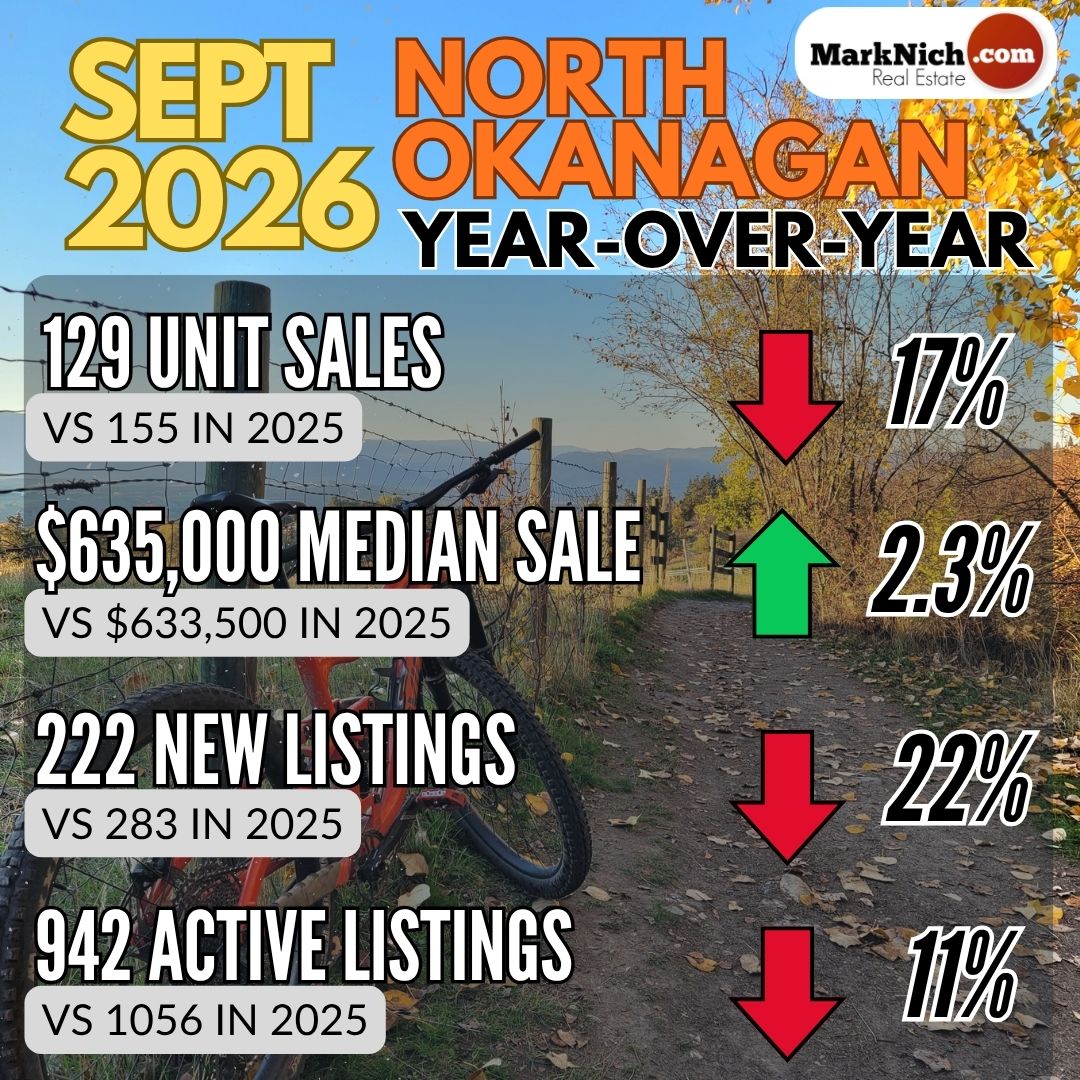
North Okanagan Unit Sales were down 17% Year-over-Year (129 vs 155) and come in 17% below the 10 Year Average (156).
If you recall August saw 111 sales which was 37% below the 10 Year Average.

Median Sales Price
- Median Selling Price was $635,000, which was up 2.3% Year-over-Year ($633,500), but down from August ($645,000).

Benchmark Price
- Single Family Home Benchmark price is $793,000, which is up 5.6% Year-Over-Year but down from Aug ($794,300)
- Townhome Benchmark price is $563,400, which down 1.1% Year-over-Year and down from Aug ($545,900).
- Condo Benchmark price is $324,300, which up 4.4% Year-over-Year and up from Aug ($302,400).
- The Overall Composite Benchmark Price for the North Okanagan was up 5% Year-over-Year ($686,600 vs $654,000) and up from Aug ($680,400).

New Listings hitting the market were down 22% Year-over-Year (222 vs 283) which is about 9% below the 10-Year average (243).

Active Listings are down 11%Year-over-Year (942 vs 1056), which puts the North Okanagan about 5% above the 10 year average (897).


The overall North Okanagan is in a Balanced Market.
The Sales to Active Listings ratio is 14% (up from 11% in Aug).
Between 12-25% is considered a Balanced Market.
The Sales to New Listing ratio is 58% (up from 53% in Aug).
Between 40-60% is considered a Balanced Market.
Central Okanagan
Unit Sales in the Central Okanagan were down 13% Year-over-Year (320 vs 367), which is 21% below the 10 Year Average of 404.
Benchmark Price
- Single Family homes price $1,057,200 which is up 3.4% Year-over-Year but unchanged from Aug ($1,056,700)
- Townhome price $696,600 which is down 5.5% Year-over-Year but unchanged from Aug ($698,600)
- Condo price is $496,700 which is up 2% Year-over-Year and up from Aug ($465,700)
- The Overall Composite Benchmark Price for the Central Okanagan was up 2% Year-over-Year ($797,500 vs $781,700) and up from Aug ($788,000)
The chart below shows Benchmark Prices for the Central Okanagan over the past 24 months.

Sept saw 778 New Listings hit the market, which is down 20% Year-over-Year (972) and 7% below the 10-Year Average of 836.
And the 2953 current Active Listings is down 10% Year-over-Year (3279).
With a Sales to Active Listings ratio of 11% and Sales to New Listings ratio of 41% the Central Okanagan continues to straddle the line between a Buyers Market and a Balanced Market.
|


Comments:
Post Your Comment: