RSS

April Market Snapshot
 

Slower Sales Continue in the North Okanagan

Items of Note for April

  • North Okanagan sales down 10% Year-over-Year 
  • Sales 25% below the 10 Year Average
  • Year to date sales down 8.8% vs 2025 and 23% below 10 Year Avg
  • North Okanagan on the fence between a Buyer's and Balanced Market 
  • Central Okanagan sales down 4% Year-over-Year and 16% below the 10 Year Average
  • British Columbia residential home sales down 1.9% Year-over-Year and 25% below the 10 Year Average
  • Next Bank of Canada rate announcement June 10


The North Okanagan market continued its slower pace through April, with sales down 10% year-over-year and sitting roughly 25% below the 10-year average. Notably, April 2026 is the second slowest year for sales in the past decade, with only April 2020 at the onset of COVID seeing lower activity. Year-to-date, sales are down 8.8% compared to 2025, reinforcing the more cautious tone we’ve been seeing throughout the spring market.

Despite softer sales activity, pricing has held relatively steady. The median sale price rose 4% year-over-year to $672,450, while benchmark prices showed mixed results depending on property type. Single-family homes remained relatively flat, while townhomes saw stronger growth, up 4.3%. 

Inventory levels continue to give buyers decent choice. Active listings are up about 21% above the 10-year average, even though they are down slightly compared to last year. Meanwhile, new listings declined by 13% year-over-year, suggesting sellers are also taking a more measured approach. The result is a market that isn’t oversupplied, but also not experiencing strong demand.

The North Okanagan remains right on the line between a balanced and buyer’s market, with homes taking about 61 days to sell on average. Well-priced properties are still moving, while others are seeing price reductions before attracting offers.

Across the region, similar trends continue. Central Okanagan sales were down 4% year-over-year and remain 16% below long-term averages, while BC home sales dipped 1.9% and sit 25% below the 10-year norm.

Overall, the market is steady but cautious. Buyers have more leverage, sellers need to be strategic, and many are watching the next Bank of Canada rate decision on June 10 for direction heading into summer.


Sales

North Okanagan Unit Sales were down 9.7% Year-over-Year (129 vs 143) and come in 25.4% below the 10 Year Average (173).  
YTD sales are down 8.8% from 2025 (417 vs 457) and 23.3% below the 10 Year Average (544).
In the last 10 years only April 2020 saw fewer sales (69).
April 2021 saw 324 sales which is the most monthly sales in the North Okanagan for any month since at least 2008.
April 2022 was the last time actual sales were above the 10 Year Average


Median Sales Price

  • Median Selling Price was $672,450, which was up 4% Year-over-Year ($646,000), and up from March ($634,500). 


Benchmark Price

  • Single Family Home Benchmark price is $758,000, which is down 0.6% Year-Over-Year and down from March ($761,700)
  • Townhome Benchmark price is $600,700, which up 4.3% Year-over-Year and up from March ($548,900).
  • Condo Benchmark price is $320,000, which is down 0.9% Year-over-Year but up from March ($303,900). 
  • The Overall Composite Benchmark Price for the North Okanagan was up 1.1% Year-over-Year ($670,100 vs $662,600) and down from March ($656,400).


New Listings hitting the market were down 13% Year-over-Year (343 vs 394) which is about 3% below the 10-Year average (332).  

Active Listings are down 3%Year-over-Year (980 vs 1015), which puts the North Okanagan about 21% above the 10 year average (811) for the month of April


The overall North Okanagan market continues to straddle the fence between a Balanced Market and a Buyer's Market.

The Sales to Active Listings ratio is 13% (down from 14% in March).
Between 12-25% is considered a Balanced Market.

The Sales to New Listing ratio is 38% (down from 39% in March).
Between 40-60% is considered a Balanced Market. 

Days to Sell Average is 61 days.  This is unchanged Year-over-Year (61),


Central Okanagan


Unit Sales in the Central Okanagan were down 3.6% Year-over-Year (399 vs 414), which is 16% below the 10 Year Average of 476.  April Year-To-Date sales are 2.4% below 2025 (1238 vs 1269) and 20.1% below the 10 Year Average (1550).
 

Benchmark Price 

  • Single Family homes price $1,049,900 which is down 1% Year-over-Year and unchanged from March ($1,047,900)
  • Townhome price $724,000 which is down 1.5% Year-over-Year and unchanged from March ($725,500)
  • Condo price is $497,500 which is down 2.3% Year-over-Year but up from March ($471,800)
  • The Overall Composite Benchmark Price for the Central Okanagan was unchanged Year-over-Year ($798,900 vs $797,600) and up from March ($777,500)

The chart below shows Benchmark Prices for the Central Okanagan over the past 24 months.


April saw 1039 New Listings hit the market, which is down 14% Year-over-Year (1207) and 4.7% above the 10-Year Average of 992.

And the 3057 current Active Listings is down 8.5% Year-over-Year (3342) and is 34.5% above the 10-year average of 2272.

With a Sales to Active Listings ratio of 13% and Sales to New Listings ratio of 38% the Central Okanagan straddles the line between a Buyer's Market and a balanced market.  


Okanagan Shuswap Report

Local Residential Real Estate Market Activity Showing Stability and Resilience

KELOWNA, B.C. – May 5, 2026  Residential real estate activity in April showed great resilience in the Interior in comparison to other BC markets, reports the Association of Interior REALTORS® (the Association).

A total of 1,319 residential unit sales were recorded across the Association region in April, up from March’s 1,154 units, and up 0.2% compared to units sold in April 2025.

New residential listings saw an 8.9% decrease compared to April 2025 with 3,134 new listings recorded last month, yet up from the previous month’s 3,059 new listings. The total number of active listings saw a 5.0% decrease in inventory compared to April 2025 with 8,926 recorded across the Association region. The only percentage increase in active listings across the Association region was recorded in the Kamloops and District region with a total increase of 2.3% compared to April last year.

“With sales closely tracking last year’s activity, the Interior real estate market remains comparatively resilient amid other provincial markets that are experiencing increased volatility,” says Association of Interior REALTORS® President Ryan Mayne, adding that “with healthy inventory levels, balanced market conditions and prices staying fairly steady, it remains important for sellers to price appropriately at the onset so listings don’t go stale.”

In the Okanagan and Shuswap/Revelstoke regions, the benchmark price for single-family homes saw decreases last month in all sub-areas in year-over-year comparisons with the exception of the Shuswap/Revelstoke region that saw a percentage increase of 2.3%, coming in at $725,800. The townhome housing category saw percentage increases in all sub-areas with the exception of the Central Okanagan region that saw a slight decrease of 1.5% compared to the same month the previous year, coming in at $724,000. The benchmark price in the condominium housing category saw decreases in all sub-regions compared to April 2025 with the highest percentage decrease of 2.3% recorded in the Central Okanagan, coming in at $497,500.


Given the high stakes on such a significant financial transaction, home sellers and buyers can benefit from the knowledge and skills of a practiced REALTOR®. Contact your local REALTOR® Mark Nichiporuk to find out more about the real estate market and how I can help you achieve your real estate goals.


British Columbia Report

Market Activity Endures Through Foreign and Domestic Headwinds
 

Vancouver, BC – May 11, 2026. The British Columbia Real Estate Association (BCREA) reports that 6,311 residential unit sales were recorded in Multiple Listing Service® (MLS®) Systems in April 2026, down 1.9 per cent from April 2025. The average MLS® residential price in BC in April 2026 was up 0.8 per cent at $952,768 compared to $944,796 in April 2025.

chart

Total MLS® residential sales dollar volume was $6.01 billion, down 1.1 per cent from the same time the previous year. BC MLS® unit sales were 25.38 per cent lower than the ten-year average for the month of April.

“Challenges in the local economy and labour market, combined with upward pressure on rates due to the ongoing oil supply shock, are continuing to suppress pent-up demand and weaken overall market activity,” said BCREA Chief Economist Brendon Ogmundson. “However, modest monthly gains (seasonally adjusted) in some regions hopefully depict the beginning of a broader stabilization in housing activity, underpinned by improved affordability conditions that should encourage prospective buyers to enter the market.”

Year-to-date, BC residential sales dollar volume is down 9.5 per cent to $18.7 billion, compared with the same period in 2025. Residential unit sales are down 7.6 per cent year-over-year at 20,059 units, while the average MLS® residential price is also down 2 per cent to $932,492.

table
Read

March Market Snapshot


A Cautious Start to Spring

Items of Note for March

  • North Okanagan Year-over-Year sales unchanged Year-over-Year 
  • Sales 26% below the 10 Year Average for the second month in a row 
  • North Okanagan on the fence between a Buyer's and Balanced Market 
  • Central Okanagan sales up 6% Year-over-Year but still 22% below the 10 Year Average
  • British Columbia residential home sales down 9.7% Year-over-Year
  • Next Bank of Canada rate announcement April 29


North Okanagan sales held steady year-over-year but remain 26% below the 10-year average — a reflection of the cautious tone that has defined the market heading into spring. Prices followed a similar pattern: the median selling price edged up 2.3% year-over-year, while benchmark prices dipped slightly across all property types.

On the supply side, new listings were down 12% year-over-year but are tracking close to the 10-year average. Total active inventory is essentially unchanged from last year and sits roughly 20% above the long-term average — meaning buyers have options, but sellers aren't flooding the market either.

The mood right now is measured on both sides. Homes priced correctly are still moving quickly at any price point. Those sitting longer are generally seeing price reductions before attracting offers. With ongoing uncertainty — both domestically and globally — there's no strong sense of urgency from buyers or sellers, and the data reflects that.


Sales

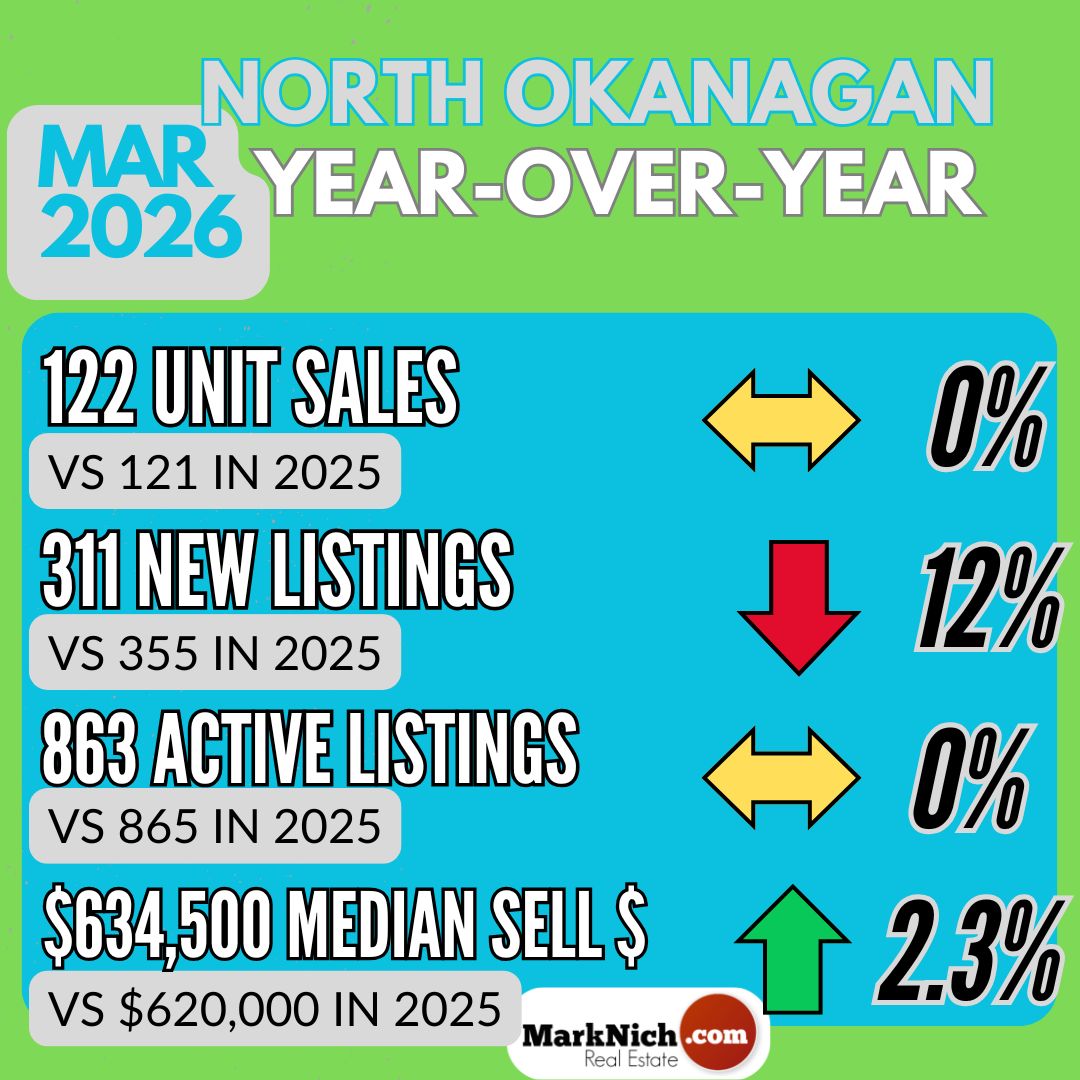
North Okanagan Unit Sales were unchanged Year-over-Year (122 vs 121) and come in 26% below the 10 Year Average (164).  


Median Sales Price

  • Median Selling Price was $634,500, which was up 2% Year-over-Year ($620,000), but down from Feb ($644,000). 


North Okanagan Median Selling Price since 2022 peak.


Benchmark Price

  • Single Family Home Benchmark price is $761,700, which is down 1.1% Year-Over-Year and down from Feb ($781,200)
  • Townhome Benchmark price is $548,900, which down 4.0% Year-over-Year but unchanged from Feb ($546,000).
  • Condo Benchmark price is $303,900, which is down 4.8% Year-over-Year and unchanged from Feb ($303,500). 
  • The Overall Composite Benchmark Price for the North Okanagan was down 1.6% Year-over-Year ($656,400 vs $666,800) and down from Feb ($667,800).


Benchmark Selling Prices for the North Okanagan since the peak of the market March 2022. 


New Listings hitting the market were down 12% Year-over-Year (311 vs 355) which is about 3% below the 10-Year average (322).  


Active Listings are unchanged Year-over-Year (863 vs 865), which puts the North Okanagan about 20% above the 10 year average (722) for the month of March.


The overall North Okanagan market continues to straddle the fence between a Balanced Market and a Buyer's Market.

The Sales to Active Listings ratio is 14% (up from 11.7% in Feb). 
Between 12-25% is considered a Balanced Market.

The Sales to New Listing ratio is 39% (unchanged from Feb).
Between 40-60% is considered a Balanced Market. 

Days to Sell Average is 85 days.  This is up Year-over-Year (64) but down sightly from Feb (86).


Central Okanagan


Unit Sales in the Central Okanagan for January were up 6% Year-over-Year (364 vs 343), which is 22% below the 10 Year Average of 476.  
 

Benchmark Price 

  • Single Family homes price $1,047,900 which is down 2.3% Year-over-Year and down from February ($1,056,600)
  • Townhome price $725,500 which is down 3.4% Year-over-Year but up from February ($671,300)
  • Condo price is $471,800 which is down 5.7% Year-over-Year but unchanged from February ($472,000)
  • The Overall Composite Benchmark Price for the Central Okanagan was down 2.6% Year-over-Year ($777,500 vs $797,900) and down from January ($791,000)

The chart below shows Benchmark Prices for the Central Okanagan over the past 12 months.


March saw 1058 New Listings hit the market, which is down 11% Year-over-Year (1186) and 3% above the 10-Year Average of 1030.

And the 2798 current Active Listings is down 10% Year-over-Year (3097) and is 34% above the 10-year average of 2081.

With a Sales to Active Listings ratio of 13% and Sales to New Listings ratio of 34% the Central Okanagan straddles the line between a Buyer's Market and a balanced market.  


Okanagan Shuswap Report

Local Residential Real Estate Market Activity Picks Up Heading into Spring

KELOWNA, B.C. – April 7, 2026  Residential real estate activity in March showed signs of gaining momentum ahead of the spring market, reports the Association of Interior REALTORS® (the Association).

 A total of 1,154 residential unit sales were recorded across the Association region in March, up from February’s 838 units, and up 1.3% compared to units sold in March 2025.

New residential listings saw a 4.8% decrease compared to March 2025 with 3,059 new listings recorded last month, yet up from the previous month’s 2,235 new listings. The total number of active listings saw a 3.1% decrease in inventory compared to March 2025 with 8,112 recorded across the Association region. The highest percentage increase in active listings across the Association region was recorded in the Kamloops and District region with a total increase of 4% compared to March last year.

“Although sales are still trailing the 10-year average, recent sales activity is a positive sign as we head into the typically busy spring market. We’re seeing improvement from earlier in the year, even as inventory edges down slightly compared to the same time last year, which is likely a reflection of economic uncertainty continuing to temper some consumer confidence,” says Association of Interior REALTORS® President Kadin Rainville, adding that “in this environment, strategic pricing is essential to capture buyer attention and maximize results.”

In the Okanagan and Shuswap/Revelstoke regions, the benchmark price for single-family homes saw decreases last month in all sub-areas in year-over-year comparisons, with the highest percentage decrease of 7.8% recorded in the South Okanagan, coming in at $709,900. The townhome housing category similarly saw percentage decreases in all sub-areas, with the Shuswap/Revelstoke region seeing the highest percentage decrease of 4.1% compared to the same time the previous year, coming in at $536,800. The benchmark price in the condominium housing category saw decreases in all sub-regions compared to March 2025 with the exception of the South Okanagan that saw an increase of 1%, coming in at $425,800.


Given the high stakes on such a significant financial transaction, home sellers and buyers can benefit from the knowledge and skills of a practiced REALTOR®. Contact your local REALTOR® Mark Nichiporuk to find out more about the real estate market and how I can help you achieve your real estate goals.


British Columbia Report

Market Activity Flounders Througout the Province
 

Vancouver, BC – March 12, 2026. The British Columbia Real Estate Association (BCREA) reports that 4,516 residential unit sales were recorded in Multiple Listing Service® (MLS®) Systems in February 2026, down 9.7 per cent from February 2025. The average MLS® residential price in BC in February 2026 was down 2.9 per cent at $932,243 compared to $960,572 in February 2025.

chart

Total MLS® residential sales dollar volume was $4.21 billion, down 12.3 per cent from the same time the previous year. BC MLS® unit sales were 32.87 per cent lower than the ten-year average for the month of February.

“Housing market activity continues to struggle, with sales declining from every region in the province compared to the same time last year,” said BCREA Chief Economist Brendon Ogmundson. “We hope that improved affordability conditions in most regions and stable rates will motivate prospective demand to enter the market and drive stronger sales activity over the rest of the year.”

Year-to-date, BC residential sales dollar volume is down 17.8 per cent to $7.3 billion, compared with the same period in 2025. Residential unit sales are down 15.8 per cent year-over-year at 7,832 units, while the average MLS® residential price is also down 2.4 per cent to $929,323.

table
Read

February Market Snapshot


Sales Fall Sharply - Hit a 10 Year Low in the North Okanagan

Items of Note for February

  • North Okanagan Year-over-Year sales down 22% 
  • Sales 26% below the 10 Year Average - the lowest its been since March 2025 (-28%).  
  • North Okanagan on the fence between a Buyer's and Balanced Market 
  • Central Okanagan sales unchanged Year-over-Year and 22% below the 10 Year Average
  • British Columbia residential home sales down 9.7% Year-over-Year
  • Bank of Canada holds rates at 2.25%


If you recall the North Okanagan housing market opened 2026 on relatively solid footing - outperforming much of the province.  January sales were down 1% year-over-year and just 10% off the 10 year average. February, however, brought a notable pullback, with only 88 units sold, down 22% Year-over-Year and 26% below the 10-year average.  These are the lowest sales figures for the month of February in the past 10 years.  Ouch!


Despite softer sales, prices held firm: the median reached $644,000 and the average $705,735, both up 7% Year-over-Year. Benchmark results were mixed, with single-family homes and townhomes edging up while condos dipped.


Inventory climbed to 751 active listings — near a 10-year high, though still well below 2010–2016 levels — keeping the market straddling between a buyer's and a balanced market.

Given the market's resilience through most of 2025, February's dip may prove to be a blip, though speculation about rising interest rates bears watching as we head into spring.


For Buyers: More inventory and a slower sales pace means more options and stronger negotiating leverage, particularly on homes that have sat on the market as new listings surge in March with the start of the spring market.


For Sellers: Prices remain stable but the market is more competitive — accurate pricing, strong presentation, and strategic marketing will be key to a successful spring sale.


Sales

North Okanagan Unit Sales were down 22% Year-over-Year (88 vs 113) and come in 26% below the 10 Year Average (119).  


Median Sales Price

  • Median Selling Price was $644,000, which was up 7% Year-over-Year ($600,000), but down from Jan ($680,000). 


Average Sales Price
  • Average Selling Price was $705,735, which is up 7% Year-over-Year ($656,829), and up from Jan ($685,756).


Benchmark Price

  • Single Family Home Benchmark price is $781,200, which is up 1.1% Year-Over-Year and up from Jan ($745,200)
  • Townhome Benchmark price is $553,100, which up 4.6% Year-over-Year and up from Jan ($504,900).
  • Condo Benchmark price is $303,500, which is down 7.1% Year-over-Year and down from Jan ($324,800). 
  • The Overall Composite Benchmark Price for the North Okanagan was up 2% Year-over-Year ($667,800 vs $654,900) and up from Jan ($636,900).


Benchmark Selling Prices for the North Okanagan since the peak of the market March 2022. 


New Listings hitting the market were down 5% Year-over-Year (227 vs 239) which is about 8% above the 10-Year average (211).  


Active Listings are up 3% Year-over-Year (751 vs 727), which puts the North Okanagan about 19% above the 10 year average (630) for the month of February.


The overall North Okanagan market continues to straddle the fence between a Balanced Market and a Buyer's Market.

The Sales to Active Listings ratio is 11.7% (unchanged from 11.6% in Jan). 
Between 12-25% is considered a Balanced Market.

The Sales to New Listing ratio is 39% (down from 45% in Jan). 

Days to Sell Average is 86 days.  This is down Year-over-Year (103) but up from January (83).


Central Okanagan


Unit Sales in the Central Okanagan for January were unchanged Year-over-Year (273 vs 271), which is 22% below the 10 Year Average of 351.  
 

Benchmark Price 

  • Single Family homes price $1,056,600 which is basically unchanged Year-over-Year and unchanged from January ($1,060,300)
  • Townhome price $671,300 which is down 8.1% Year-over-Year and down from January ($678,400)
  • Condo price is $472,000 which is down 7.3% Year-over-Year and down from January ($504,600)
  • The Overall Composite Benchmark Price for the Central Okanagan was down 2.6% Year-over-Year ($777,500 vs $797,900) and down from January ($791,000)

The chart below shows Benchmark Prices for the Central Okanagan since the market peak March 2022.


December saw 823 New Listings hit the market, which is down 9% Year-over-Year (902) and 12% above the 10-Year Average of 735.

And the 2514 current Active Listings is down 6% Year-over-Year (2688) and is 38% above the 10-year average of 1822.

With a Sales to Active Listings ratio of 11% and Sales to New Listings ratio of 38% the Central Okanagan continues to be in a Buyer's Market but is very close to entering a balanced market.  


Okanagan Shuswap Report

Local Residential Real Estate Market Sees Modest Bounce-Back in Sales

KELOWNA, B.C. – March 4, 2026  Residential real estate activity in February experienced a modest rebound following a slower-than-expected January, reports the Association of Interior REALTORS® (the Association).

A total of 838 residential unit sales were recorded across the Association region in February, up from January’s 623 units, and down 8.0% compared to units sold in February 2025.

New residential listings saw a 3% decrease compared to February 2025 with 2,235 new listings recorded last month. The total number of active listings saw a 1.9% decrease in inventory compared to February 2025 with 7,206 recorded across the Association region. The highest percentage increase in active listings across the Association region was recorded for another consecutive month in the North Okanagan with a total increase of 4.2% compared to February last year.

“After a sluggish start to the year in January, sales seemed to return to a more normal pace last month. Although we’re still sitting just below average levels, momentum is building and heading in the right direction,” says Association of Interior REALTORS® President Kadin Rainville, adding that “demand hasn’t disappeared, and with more listings coming online, we may just be seeing a natural lag between renewed interest and finalized sales.”

In the Okanagan and Shuswap/Revelstoke regions, the benchmark price for single-family homes saw decreases last month in the Central and South Okanagan in year-over-year comparisons of 0.9% and 5.7% respectively, coming in at $1,056,600 and 691,900. The townhome housing category recorded the Central and South Okanagan as the only sub-regions that saw a decrease of 8.1% and 6.0% compared to the same time the previous year, coming in at $671,300 and $483,200 respectively. The benchmark price in the condominium housing category saw decreases in all regions compared to February 2025 with the exception of the South Okanagan that saw an increase of 1.4%, coming in at $410,400.

Given the high stakes on such a significant financial transaction, home sellers and buyers can benefit from the knowledge and skills of a practiced REALTOR®. Contact your local REALTOR® Mark Nichiporuk to find out more about the real estate market and how I can help you achieve your real estate goals.


British Columbia Report

Market Activity Flounders Througout the Province
 

Vancouver, BC – March 12, 2026. The British Columbia Real Estate Association (BCREA) reports that 4,516 residential unit sales were recorded in Multiple Listing Service® (MLS®) Systems in February 2026, down 9.7 per cent from February 2025. The average MLS® residential price in BC in February 2026 was down 2.9 per cent at $932,243 compared to $960,572 in February 2025.

chart

Total MLS® residential sales dollar volume was $4.21 billion, down 12.3 per cent from the same time the previous year. BC MLS® unit sales were 32.87 per cent lower than the ten-year average for the month of February.

“Housing market activity continues to struggle, with sales declining from every region in the province compared to the same time last year,” said BCREA Chief Economist Brendon Ogmundson. “We hope that improved affordability conditions in most regions and stable rates will motivate prospective demand to enter the market and drive stronger sales activity over the rest of the year.”

Year-to-date, BC residential sales dollar volume is down 17.8 per cent to $7.3 billion, compared with the same period in 2025. Residential unit sales are down 15.8 per cent year-over-year at 7,832 units, while the average MLS® residential price is also down 2.4 per cent to $929,323.

table
 
Read

Thinking of Downsizing - PART IV

Selling in 2027: What Downsizers Can Do Now to Make the Transition Easier Later

Selling in 2027 doesn’t mean waiting until 2027 to act. The most confident downsizers use the years leading up to their sale to make thoughtful, low-stress decisions.

Focus on flexibility, not rigid timelines

Instead of locking yourself into a date, focus on understanding:

  • Which housing types suit you best
  • What resale looks like for condos and townhomes
  • Which Vernon neighbourhoods align with your lifestyle

Flexibility gives you control when opportunity appears.

Reduce future friction, one step at a time

Small steps now make a big difference later:

  • Simplify possessions gradually
  • Organize important documents
  • Maintain your home consistently

This protects your energy — not just your finances.

Storage deserves its own strategy

One of the most common regrets I hear from downsizers is:

“I didn’t realize how much I’d miss having easy access to my things.”

Before you move:

  • Inventory your gear honestly
  • Decide what must stay close
  • Choose housing that supports your lifestyle, not fights it

Whether it’s bikes, skis, kayaks, or travel gear, convenient storage often determines long-term satisfaction.

Remember: downsizing is a process

The goal isn’t just to sell a house. It’s to move into a home that feels lighter, easier, and aligned with how you want to live next.

Read

January Market Snapshot

January Solid in the North Okanagan

Items of Note for January

  • North Okanagan Year-over-Year sales down 1%.  
  • Sales 10% below the 10 Year Average.  
  • North Okanagan on the fence between a Buyer's and Balanced Market 
  • Central Okanagan sales down 16% Year-over-Year and 21% below the 10 Year Average
  • British Columbia residential home sales down 24.4% Year-over-Year and 31% below the 10 Year Average
  • Bank of Canada holds overnight rate at 2.25%

A Promising Start to the Year in the North Okanagan

2026 is off to a solid start here in the North Okanagan! While many parts of BC saw slower sales in January, our market held remarkably steady. Home sales were down just 1% from last year and sit about 10% below the 10-year average — much stronger than the provincial picture, where sales dropped more than 24% and 31% respectively.

Prices remained fairly steady. The median sale price rose 8% year-over-year to $680,000, the average price came in at $685,756 - up 3%, while the overall composite benchmark price eased slightly. 

With interest rates holding steady, the North Okanagan continues to show resilience and stability.  All in all, a fairly solid kickoff to the year!


Sales

North Okanagan Unit Sales were down 1% Year-over-Year (79 vs 80) and come in 10% below the 10 Year Average.  


Median Sales Price

  • Median Selling Price was $680,000, which was up 8% Year-over-Year ($628,750), and also up from Dec ($638,000). 


Average Sales Price
  • Average Selling Price was $685,756, which is up 3% Year-over-Year ($668,100), but down from Dec ($770,635).


Benchmark Price

  • Single Family Home Benchmark price is $745,200, which is down 1.7% Year-Over-Year and down from Dec ($753,900)
  • Townhome Benchmark price is $504,900, which down 3.1% Year-over-Year and down from Dec ($556,500).
  • Condo Benchmark price is $324,800, which is down 2% Year-over-Year but up from Dec ($302,700). 
  • The Overall Composite Benchmark Price for the North Okanagan was down 1.4% Year-over-Year ($636,900 vs $645,900) and down from Dec ($653,500).


Composite Benchmark Selling Price for the North Okanagan since March 2020. 


New Listings hitting the market were down 15% Year-over-Year (176 vs 207) which is about 7% above the 10-Year average (165).  


Active Listings are unchanged Year-over-Year (676 vs 677), which puts the North Okanagan about 14% above the 10 year average (593) for the month of January.


The overall North Okanagan market downgraded from a balanced market to straddling the fence between a Balanced Market and a Buyer's Market.

The Sales to Active Listings ratio is 11.6% (down from 14% in Dec). 
Between 12-25% is considered a Balanced Market.

The Sales to New Listing ratio is 45% (down from 86% in Dec). 
Between 40-60% is considered a Balanced Market but ratios skew higher in the winter months when the number of new listings hitting the market are low.  

Days to Sell Average is 83 days.  This is up slightly Year-over-Year (82) and up from December (81).


Central Okanagan


Unit Sales in the Central Okanagan for January were down 16% Year-over-Year (203 vs 241), which is 21% below the 10 Year Average of 257.  
 

Benchmark Price 

  • Single Family homes price $1,060,300 which is basically unchanged Year-over-Year and up from December ($1,045,700)
  • Townhome price $678,400 which is down 8.7% Year-over-Year but up slightly from December ($675,700)
  • Condo price is $504,600 which is down 1.6% Year-over-Year but up from December ($470,600)
  • The Overall Composite Benchmark Price for the Central Okanagan was down 1% Year-over-Year ($791,000 vs $799,700) but up from December ($773,300)
The chart below shows the Composite Benchmark Price for the Central Okanagan since March 2020.


December saw 767 New Listings hit the market, which is down 13% Year-over-Year (885) and 26% above the 10-Year Average of 607.

And the 2323 current Active Listings is down 4% Year-over-Year (2414) and is 38% above the 10-year average of 1689.

With a Sales to Active Listings ratio of 9% and Sales to New Listings ratio of 26% the Central Okanagan continues to be in a Buyer's Market.  


For the full report click here

Read

Thinking of Downsizing - Part III

Selling in 2027: Why Downsizers in the North Okanagan Benefit From Thinking Ahead

If your goal is to sell in 2027, you’re already ahead of the curve just by thinking about it now.

The smoothest, least stressful sales are rarely rushed. They’re planned.

Market cycles matter — especially locally

The Vernon and North Okanagan market shifts with interest rates, inventory levels, and buyer demand. Planning ahead allows you to:

  • Watch trends instead of reacting to them
  • Adjust timing if conditions change
  • Avoid selling under pressure

When you’re informed early, you get to choose when to act — not feel forced.

Equity planning is central for downsizers

For many homeowners, the family home represents decades of equity. Early planning helps you:

  • Estimate realistic net proceeds
  • Compare buying vs renting
  • Decide whether to sell first or buy first

Clarity reduces anxiety and makes the next step feel achievable.

Storage and lifestyle planning belong here too

Many people don’t think about storage until after they’ve sold — and that’s often when regret sets in.

Ask yourself now:

  • Will my future home fit the lifestyle I want to keep?
  • Do I want easy access to my gear, or am I okay with downsizing hobbies?
  • Would a storage unit add ongoing cost and inconvenience?

These questions shape better decisions — long before you list.

Think about future you

Health, energy, and mobility change. Planning early lets you:

  • Move once instead of multiple times
  • Choose a home that works long-term
  • Reduce physical and emotional stress
Read

Thinking of Downsizing in 2026 - Part II

Downsizing in 2026: How to Prepare Your Home Without Overdoing It

If 2026 is your target year to downsize, preparation is your biggest advantage. What you do before you list often has a greater impact on your outcome than what you do once the sign goes up.

The biggest mistake downsizers make? Waiting too long to prepare — then feeling rushed.

Declutter early, but with intention

Start where buyers won’t see — and where stress quietly builds:

  • Garages
  • Storage rooms
  • Spare bedrooms
  • Filing cabinets and paperwork

This isn’t about purging everything. It’s about identifying what truly needs to come with you — especially items tied to your lifestyle.

Decide what’s worth keeping close

This is the moment to separate:

  • Daily-use items
  • Seasonal gear you actively enjoy
  • “Just in case” items that haven’t been used in years

If you ski every winter, bike weekly, or paddle all summer, you’ll want a future home that accommodates that without friction. If you travel all winter, your storage needs will look very different.

Downsizing works best when your next home supports your life — not when it forces constant compromises.

Focus on updates that buyers actually value

You don’t need a full renovation. In Vernon’s established neighbourhoods, buyers respond best to:

  • Fresh, neutral paint
  • Updated or well-maintained flooring
  • Good lighting
  • Minor repairs completed

Homes that feel clean, bright, and well cared for consistently outperform those that feel dated or deferred.

Get a planning conversation early

A no-pressure review 12–18 months out helps you:

  • Decide what updates are worth doing
  • Avoid unnecessary spending
  • Time your sale more confidently

Preparation creates options — and options create leverage.

Read

Thinking of Downsizing in 2026 - Part I

Downsizing in 2026: Start With the “Why” — and the Lifestyle You Actually Live

If you’re considering downsizing in 2026, the most important work doesn’t start with listings, floor plans, or even price ranges. It starts with understanding why you want to downsize — and how you actually live day to day in the Vernon and the North Okanagan area.

Downsizing done well isn’t about giving things up. It’s about right-sizing your home to fit your next chapter.

Clarify the real motivation behind your move

Local downsizers often share similar goals, but they don’t all need the same type of home. Ask yourself:

  • Are you looking for less maintenance and yard work?
  • Do stairs feel less appealing than they once did?
  • Are you traveling more and want a “lock-and-leave” lifestyle?
  • Are you freeing up equity for retirement or family?

Your answers shape every decision that follows — especially what type of home will work best.

Lifestyle matters more than square footage

Many people focus on “smaller,” but the real shift is toward simpler living. In the Okanagan, that often means prioritizing:

  • One-level or main-floor living
  • Fewer exterior responsibilities
  • Proximity to shopping, medical services, and recreation
  • Quiet communities with strong resale demand

A 1,400 sq ft home that’s well designed can feel far more livable than a poorly laid-out 2,000 sq ft house.

Storage: the piece most downsizers underestimate

This is where many downsizing plans quietly fall apart.

Before choosing your next home, take an honest look at what you actually use and enjoy:

  • Are you a pickleball player who travels south all winter?
  • Do you ski SilverStar or Sovereign Lake, bike year-round, paddle or kayak Okanagan or Kal Lake?
  • Do you own multiple bikes, skis, or seasonal gear?
  • Do you have a boat, side-by-side or travel trailer?

Many downsizers quickly realize that off-site storage units are inconvenient, costly, and frustrating over time. Repeated trips across town to grab gear often take the joy out of the lifestyle they were trying to preserve.

In this market, smart downsizers look for:

  • Oversized garages
  • Secure storage lockers
  • Ground-level storage rooms
  • Space that keeps their lifestyle close by, not locked away

Give yourself emotional breathing room

Downsizing is both practical and emotional. Starting early in 2026 gives you time to:

  • Let go gradually
  • Talk through concerns
  • Avoid rushed decisions

The goal isn’t to move fast — it’s to move well.

Read

The True Cost of Home Ownership


The True Cost of Homeownership: What You Pay Beyond the Mortgage

When many new Canadian homebuyers calculate whether they can afford a new home, they focus almost exclusively on one number: the monthly mortgage payment. It’s the figure lenders use for the mortgage stress test, the number real estate agents discuss during showings, and the benchmark buyers use to determine their budget.[ratehub]​

However, the mortgage is only the starting line. Homeowners also pay for property taxes, insurance, utilities, strata special levies, surprise repairs, and ongoing maintenance. According to housing cost breakdowns from Ratehub, these non-mortgage expenses can easily add $1,500 or more per month on top of the mortgage, depending on the home and location. When you factor in these costs, a $3,000 monthly mortgage can quickly push total housing expenses well beyond $4,500 per month.[ratehub]​

So while qualifying for a mortgage answers one question, “Can a bank trust you with this loan?”, it doesn’t answer the more important one: “Can you comfortably maintain this lifestyle?”

In today’s market, about one in four Canadian homebuyers report experiencing at least some post-purchase regret. While most homeowners remain satisfied, research shows that regret often emerges when the true cost of ownership—such as maintenance, repairs, and ongoing living expenses—was higher than expected. To reduce the risk of buyer’s remorse, it’s critical for homebuyers to plan not just for the mortgage payment, but for the full cost of living in the home.ratehub+1

The Predictable Ongoing Costs

Property Taxes
Property tax bills have been rising in many Canadian cities as municipalities work to fund infrastructure and services. In 2024, the median year-over-year change in property tax rates among 24 major Canadian cities was about 4.9 percent, with some regions experiencing even greater increases.[zoocasa]​

Property taxes aren’t fixed. Reassessments and rate changes happen regularly, and as neighbourhood values rise, so do tax bills even when the rate stays the same.[zoocasa]​

Home Insurance
As of 2026, home insurance premiums in Canada have entered a “new normal.” Record weather-related losses in recent years, combined with higher rebuilding and replacement costs, continue to push insurers to raise rates and reassess risk across many regions.[ca.investing]​

In some provinces, home insurance premiums have increased sharply over the past decade, with upward pressure emerging nationwide. As insurers recalibrate risk at the postal-code level, homeowners can see their premiums rise $100–$200 per month in a single year—even without making a claim or changing coverage.[ca.investing]​

Condo and Strata Fees
For buyers entering the condo market, monthly fees typically range from $0.60 to $1.00 per square foot, depending on the building and amenities. These fees are mandatory and are used to fund day-to-day operations as well as long-term reserve funds for major repairs.[ratehub]​

By contributing regularly, owners help reduce the risk of large, unexpected special assessments later on.[ratehub]​

Utilities
Homeowners should budget between $250 to $600 monthly for utilities including electricity, heating, water, internet, and phone services, with costs varying based on your home’s size and location. These expenses often come as a surprise to first-time buyers, particularly those transitioning from apartment living where some utilities may have been included in rent. Larger homes naturally require more energy for heating and cooling, while properties with outdoor spaces may see higher water usage during warmer months.[ratehub]​

The "Commuter Tax"
There’s also what might be called “the commuter tax.” Moving to suburban markets for a cheaper house can increase gas and transit costs that often negate the mortgage savings. That apparent price difference can disappear quickly if you’re spending hundreds of dollars more each month on commuting.

Routine Maintenance
Beyond emergencies, Canadian homes require ongoing care: lawn service, gutter cleaning, pest control, HVAC servicing, snow removal, and seasonal tasks. These aren’t luxuries for many households—they’re practical solutions to time constraints and property upkeep in Canada’s demanding climate. Collectively, these services can add $200–$400 monthly to ownership costs.[ratehub]​

The Irregular—but Inevitable—Expenses

Major System Replacements
This is where many Canadian homeowners get caught off guard. Maintenance and repairs aren’t a matter of if but when—and rising labour and material costs have made these repairs significantly more expensive in recent years.[ca.investing]​

According to Statistics Canada and industry cost reports, home repair and maintenance costs have increased materially since 2018, driven by construction inflation and labour shortages. As a result, homeowners are commonly advised to budget 1%–2% of their home’s value annually for maintenance and long-term repairs.ratehub+1

Major system replacements can add up quickly:

  • Roof replacement: $8,000–$15,000+

  • HVAC (furnace or heat pump): $5,000–$12,000

  • Water heater: $1,200–$2,500

  • Foundation repairs: $4,000–$15,000+

These aren’t hypothetical expenses—they’re inevitable over time, with uncertain timing and rising costs.

Use the inspection as a planning tool. A 15-year-old furnace or aging roof signals $8,000–$15,000 in likely expenses within the first few years. That’s not a deal-breaker—it’s a budget roadmap. Buyers who understand these timelines can plan strategically instead of scrambling when systems fail.

Canada’s climate makes this worse. The “freeze-thaw” cycle wears down roofs, driveways, and foundations faster than in many milder climates, shortening the effective lifespan of key components. A roof that might last 25 years in a gentler environment may need replacement years sooner in parts of Canada.

Newer isn’t maintenance-free. Newer builds offer a temporary reprieve, but systems still age, warranties expire, and eventually every home requires major capital improvements.

Emergency repairs happen at the worst times. An HVAC failure during a cold snap, a burst pipe in winter, or ice dam damage to the roof—these scenarios happen when it’s least convenient and most expensive. Without liquid reserves, a single emergency can derail finances entirely.

Ownership Costs That Creep Up Over Time

Here’s what surprises many first-time Canadian buyers: the so-called “fixed costs” of homeownership aren’t actually fixed.

While a locked-rate mortgage provides payment stability for your term (typically 5 years in Canada), the other components—taxes, insurance, and condo fees—can climb significantly year over year due to inflation, climate risk, and local policy changes. A mortgage payment that felt comfortable at closing can feel tight three years later, even without lifestyle changes.[zoocasa]​

The “2026 Renewal Wall” presents a significant challenge for Canadian homeowners. Approximately 60% of all outstanding mortgages in Canada are expected to renew in 2025 or 2026, with many owners facing substantial payment increases. Unexpected costs go beyond just maintenance and repairs. Many homeowners will experience sticker shock when their mortgage payments reset at higher rates upon renewal.collectorhq+1

The same gradual creep affects utilities, maintenance services, and every other aspect of homeownership.[ratehub]​

Planning Smarter: How Canadian Homeowners Can Stay Ahead

Create a Dedicated House Repair Fund
Separate from emergency savings, this fund exists solely for home maintenance and repairs. Treat it like a non-negotiable monthly bill—set up automatic transfers so it happens without thinking about it.

The old rule of saving 1% of your home’s value annually for repairs is proving insufficient for some homeowners, particularly those with older properties or homes experiencing extreme weather. Aim for 2% if possible. For a newer home with recent updates, less might suffice. For an older property or one with systems nearing end-of-life, you’ll likely need to plan for greater costs.[ratehub]​

Don’t Drain Your Savings at Closing
Cash reserves protect against surprises and prevent forced debt when repairs arise. If possible, keep a liquid emergency repair fund after closing rather than putting every available dollar into the down payment or immediate renovations. That breathing room matters more than most buyers realize.[ratehub]​

Invest in Preventative Maintenance
Annual furnace servicing, gutter cleaning, and seasonal inspections catch small problems before they become expensive emergencies. A modest service call that prevents a major system failure is almost always worthwhile.

Create a seasonal maintenance calendar: HVAC checkups in spring and fall, gutter cleaning before winter, roof inspections after major storms. Consistency prevents costly surprises.

Leverage Canadian Tax Advantages
Consider leveraging Canadian tax advantages to build these reserves. First-time buyers should keep their FHSA (First Home Savings Account) open after purchase, or use the tax refund generated by it to seed their repair fund. The tax benefits you received while saving for the down payment can continue working for you as a homeowner.[ratehub]​

Know Your Home’s Systems and Timelines
Understanding when major systems were last replaced helps predict future expenses. A 15-year-old water heater isn’t an emergency today, but it signals a likely expense within the first few years of ownership. Planning beats scrambling.

Why Homeownership Still Makes Sense

Long-Term Equity Building
Mortgage payments build equity with every payment. Unlike rent, ownership creates a forced savings mechanism that compounds over decades. In most markets, homes appreciate over time, multiplying the wealth-building effect.[ratehub]​

Stability and Control
Homeowners control their living environment. Want to renovate the kitchen, paint the walls, landscape the yard, or install solar panels? Ownership provides autonomy that renting does not. That control has both lifestyle and financial value.[ratehub]​

Predictability vs. Rent Volatility
While ownership costs rise gradually over time, rent increases can be sudden and dramatic. A fixed-rate mortgage provides a level of predictability that the rental market cannot match.ratehub+1

Yes, taxes and insurance increase, but the principal and interest portion—typically a majority of the total payment—remains locked for your term. Renters face volatility on 100% of their housing costs.ratehub+1

Lifestyle Benefits
Beyond finances, homeownership offers intangible benefits: deeper community roots, stability for families, space for hobbies, and the pride of building something that’s truly yours. These benefits have real value, even if they don’t appear on a balance sheet.

The key is ensuring the financial foundation supports the lifestyle, not undermines it.

A Better Way to Think About Affordability

The true measure of affordability isn’t what a lender will approve—it’s what allows you to sleep well at night when the furnace fails or your mortgage comes up for renewal.

The smartest buyers calculate affordability as “mortgage plus carrying costs” from the start. This might narrow the price range slightly, but it creates breathing room and peace of mind that makes a house feel like a home.[ratehub]​

Homeownership remains one of the most powerful wealth-building tools available to Canadian families, but only when approached with financial realism rather than maximum leverage. Having an honest conversation about what affordability truly looks like isn’t about limiting dreams—it’s about making sure those dreams don’t become financial nightmares.[ratehub]​

Read

2025 Year in Review


North Okanagan Real Estate Wrap-Up: 2025 Ends on a Positive Note

After a fairly strong start early in the year, the North Okanagan real estate market faced a few bumps before regaining some momentum to close 2025 on solid footing. Activity early on reflected confidence, but external factors — including market uncertainty tied to U.S. policies under President Trump and the impact of tariffs — briefly slowed things down through spring. By mid-year, however, the market regained some positive momentum, finishing in a balanced position with sales improving across the board.


Early Momentum

The year began with notable strength. In January, sales soared 34% year over year, though they remained about 10% below the 10-year average. February continued the upward trend, up 20% over the previous year and tracking just 7% below the 10-year-average. Both months reflected absorption rates straddling between a buyer’s and balanced market.


A Spring Slowdown

March maintained solid year-over-year gains (+33%) but lost considerable footing versus long term sales figures coming in 28% under the 10-year average. By April, growth stalled, with no change over the previous year and continued weakness compared to longer-term trends. May marked possibly the lowest point of the year, with sales down 12% year over year and 21% below the 10-year-average; although the market did move back into balanced market territory.


Steady Recovery Through Summer

The turnaround began in June, as confidence crept back into the market. Sales grew modestly by 4% compared to 2024 and closed 16.5% under the 10-year average — a marked improvement from spring’s gaps. July and August kept the momentum going with year-over-year increases of 12% and 21% respectively.


A Mixed Bag Finish

The fall months brought even stronger performance. September led the pack with a 51% year-over-year surge, bringing sales within 3.7% of the 10-year average. Things then cooled off for a couple months with October seeing an 18% bump year-over-year and 13% off the 10 year average, while November saw -10% and -20% respectively.  December wrapped the year on a bright note with sales up 20% over 2024 and right on par with the 10-year-average average.


Bank of Canada


The Bank of Canada’s overnight rate started the year at 3.25% with 0.25% drops in January and again in March bringing the BoC rate down to 2.75% where it stayed until September.  Rates came down 0.25% in Sept and again in October bringing the BoC rate down to 2.25% where it finished off the year


The Takeaway

Despite spring headwinds, the North Okanagan market demonstrated resilience.  Sales numbers versus the 10-year-average made fairly steady gains after March lows (-28%) and ended the year with sales equaling the 10-year-average in December (a first since March 2022). 

Buyers benefited from interest rate relief and growing inventory through the year, while sellers saw balanced market conditions nine out of 12 months and renewed optimism as sales strengthened through the second half of the year (for the most part). 

It may have been a bit of a finicky market for sellers, but with the right pricing strategy homes sold (and often sold quickly).

Compared to many markets around the province - especially Greater Vancouver and the Fraser Valley - the North Okanagan faired quite well.

With slowly growing demand, good inventory levels, and with interest rates predicted to remain steady through 2026 the North Okanagan real estate market looks poised to continue to slowly gain strength.  While not a hot real estate year by any means 2025 did show continued growth and ended with stronger sales numbers than 2024 and 2023. 

Read

December Market Snapshot

December Closes the Year Strong in the North Okanagan

Items of Note for December

  •  North Okanagan Year-over-Year sales up 20%.  
  • Sales finally equal the 10 Year Average.  This is the first time since April 2022 that unit sales were not below the 10 Year Average.
  • North Okanagan continues to be in a Balanced Market 
  • Central Okanagan sales down 4% Year-over-Year and 13% below the 10 Year Average
  • British Columbia residential home sales down 5.9% Year-over-Year.
  • Next Bank of Canada rate announcement Wednesday January 28.
 

Sales

North Okanagan Unit Sales were up 20% Year-over-Year (98 vs 82) which equals the 10 Year Average of 98.  After being close to beating the 10 Year Average in September sales slowed down in Oct and Nov but December ended the year on a strong note.  Not only was it the first time since April 2022 that sales didn't come in below the 10 Year Average but it was also the strongest December in four years. 


Median Sales Price

  • Median Selling Price was $638,000, which was down 9% Year-over-Year ($702,000), and also down from Nov ($646,700). 


Average Sales Price
  • Average Selling Price was $770,635, which is up 7% Year-over-Year ($719,209), and also up from Nov ($679,689).


Benchmark Price

  • Single Family Home Benchmark price is $753,900, which is unchanged Year-Over-Year and up from November ($739,400)
  • Townhome Benchmark price is $556,500, which up 6% Year-over-Year but unchanged from November ($557,600).
  • Condo Benchmark price is $302,700, which is down 1% Year-over-Year and down from November ($309,800). 
  • The Overall Composite Benchmark Price for the North Okanagan was up almost 2% Year-over-Year ($653,500 vs $641,400) and up from November ($644,800).


Composite Benchmark Selling Price for the North Okanagan since March 2020. 


New Listings hitting the market were up 13% Year-over-Year (114 vs 101) which is about 21% above the 10-Year average (94).  

Active Listings are up 12% Year-over-Year (710 vs 634), which puts the North Okanagan about 20% above the 10 year average (594) for the month of December.


The overall North Okanagan market continues to be in a balanced market.

The Sales to Active Listings ratio is 14% (up from 13% in November). 
Between 12-25% is considered a Balanced Market.

The Sales to New Listing ratio is 86% (up from 63% in November). 
Between 40-60% is considered a Balanced Market but ratios skew higher in the winter months when the number of new listings hitting the market are low.  

Days to Sell Average is 81 days.  This is down Year-over-Year (99) and unchanged from November (81).


Central Okanagan


Unit Sales in the Central Okanagan for December were down 4% Year-over-Year (240 vs 250), which is 13% below the 10 Year Average of 277.  If you recall, November sales came in 25% below the 10 Year Average. 
 

Benchmark Price 

  • Single Family homes price $1,045,700 which is basically unchanged Year-over-Year and up from November ($1,021,000)
  • Townhome price $675,700 which is down 9.5% Year-over-Year and down from November ($752,800)
  • Condo price is $470,600 which is unchanged Year-over-Year but down from November ($486,700)
  • The Overall Composite Benchmark Price for the Central Okanagan was down Year-over-Year ($773,300 vs $784,100) and down from November ($787,700)
The chart below shows the Composite Benchmark Price for the Central Okanagan since March 2020.


December saw 365 New Listings hit the market, which is up 9% Year-over-Year (334) and 13% above the 10-Year Average of 324.

And the 2358 current Active Listings is up 2% Year-over-Year (2309) and is 42% above the 10-year average of 1665.

With a Sales to Active Listings ratio of 10% and Sales to New Listings ratio of 66% the Central Okanagan continues to be in a Buyer's Market.  

 For the full report click here
Read

November Market Snapshot

The Market Slows Down for the Holidays Early in the North Okanagan

Items of Note for November

  •  North Okanagan Year-over-Year sales down 10%.  Since November 2023 there have only been two months that experienced Year-over-Year sales declines (May being the other one).
  • Sales take a another step back against the 10 Year Average.  November sales in the North Okanagan come in 20% below the 10 Year Average - this is after September sales figures came in just 3.7% below the 10 Year Average. 
  • Central Okanagan sales down 8% Year-over-Year and 25% below the 10 Year Average
  • British Columbia residential home sales down 13% Year-over-Year.
  • Bank of Canada holds overnight rate at 2.25% .
 

Sales

North Okanagan Unit Sales were down 10% Year-over-Year (106 vs 118) which is 20% below the 10 Year Average of 132. 


Median Sales Price

  • Median Selling Price was $646,700, which was up 2% Year-over-Year ($631,25000), and up from Oct ($624,500). 


Average Sales Price
  • Average Selling Price was $679,689, which is unchanged Year-over-Year ($676,520), but down from Oct ($709,393).


Benchmark Price

  • Single Family Home Benchmark price is $739,400, which is down 3% Year-Over-Year and also down from October ($773,400)
  • Townhome Benchmark price is $557,600, which down 7% Year-over-Year and down from October ($570,300).
  • Condo Benchmark price is $309,800, which is up 1% Year-over-Year and but down from October ($314,800). 
  • The Overall Composite Benchmark Price for the North Okanagan was down Year-over-Year ($644,800 vs $664,700) and unchanged from October ($646,200).


Composite Benchmark Selling Price for the North Okanagan since March 2020. 


New Listings hitting the market were up 6% Year-over-Year (169 vs 160) which is about 4% above the 10-Year average (163).  

Active Listings are up 10% Year-over-Year (833 vs 756), which puts the North Okanagan about 17% above the 10 year average (713) for the month of November.


The overall North Okanagan market continues to be in a balanced market.

The Sales to Active Listings ratio is 13% (down from 16% in Octoberr, 15% in Sept, Aug, July, June and May). 
Between 12-25% is considered a Balanced Market.

The Sales to New Listing ratio is 63% (down from 74% in October). 
Between 40-60% is considered a Balanced Market.  

Days to Sell Average is 81 days.  This is up Year-over-Year (76) and up from October (79).


For the full report click here

Read
The trademarks REALTOR®, REALTORS®, and the REALTOR® logo are controlled by The Canadian Real Estate Association (CREA) and identify real estate professionals who are member’s of CREA. The trademarks MLS®, Multiple Listing Service® and the associated logos are owned by CREA and identify the quality of services provided by real estate professionals who are members of CREA. Used under license.