December Closes the Year Strong in the North Okanagan
Items of Note for December
- North Okanagan Year-over-Year sales up 20%.
- Sales finally equal the 10 Year Average. This is the first time since April 2022 that unit sales were not below the 10 Year Average.
- North Okanagan continues to be in a Balanced Market
- Central Okanagan sales down 4% Year-over-Year and 13% below the 10 Year Average
- British Columbia residential home sales down 5.9% Year-over-Year.
- Next Bank of Canada rate announcement Wednesday January 28.
Sales
North Okanagan Unit Sales were up 20% Year-over-Year (98 vs 82) which equals the 10 Year Average of 98. After being close to beating the 10 Year Average in September sales slowed down in Oct and Nov but December ended the year on a strong note. Not only was it the first time since April 2022 that sales didn't come in below the 10 Year Average but it was also the strongest December in four years. 


Median Sales Price
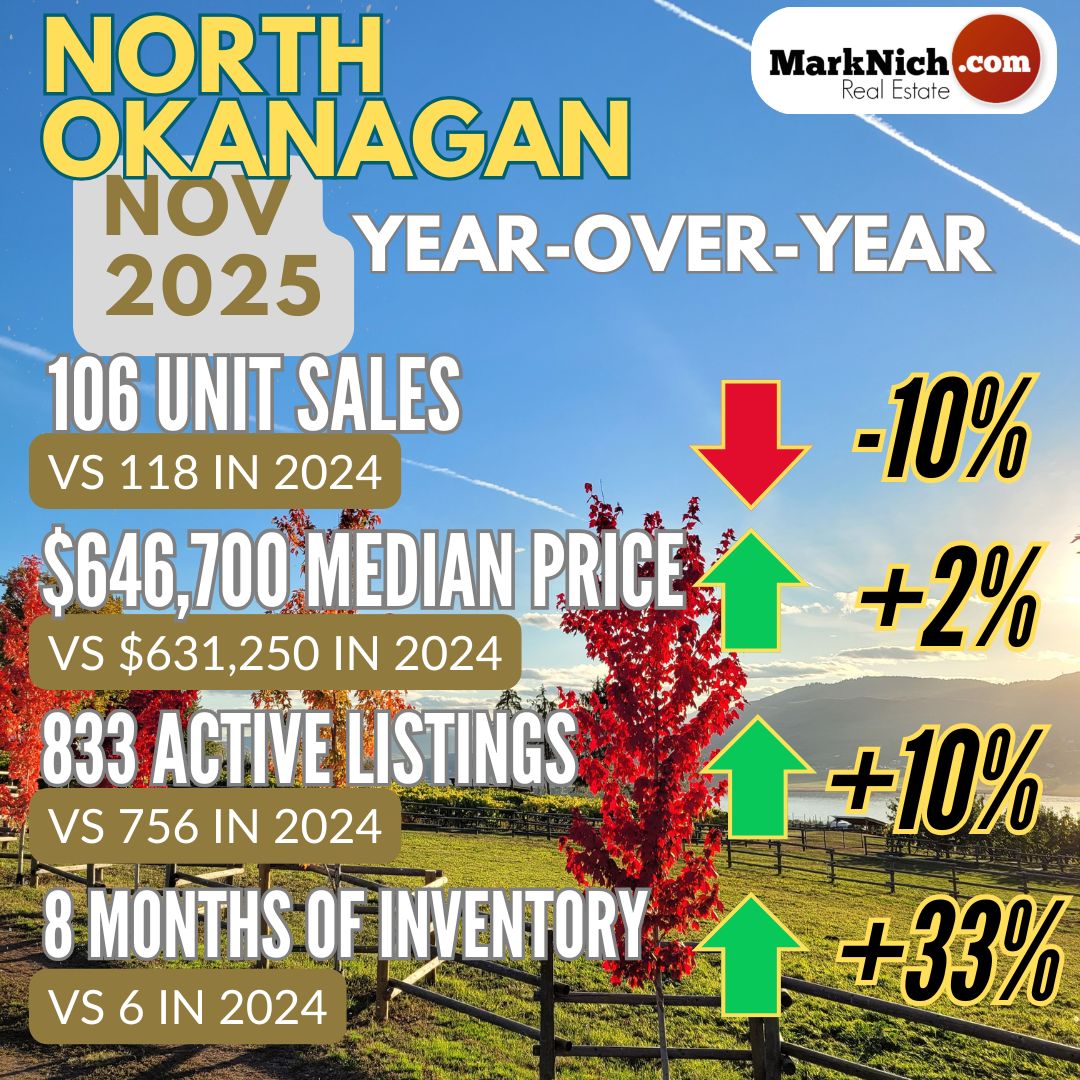
- Median Selling Price was $638,000, which was down 9% Year-over-Year ($702,000), and also down from Nov ($646,700).
Average Sales Price
- Average Selling Price was $770,635, which is up 7% Year-over-Year ($719,209), and also up from Nov ($679,689).

Benchmark Price
- Single Family Home Benchmark price is $753,900, which is unchanged Year-Over-Year and up from November ($739,400)
- Townhome Benchmark price is $556,500, which up 6% Year-over-Year but unchanged from November ($557,600).
- Condo Benchmark price is $302,700, which is down 1% Year-over-Year and down from November ($309,800).
- The Overall Composite Benchmark Price for the North Okanagan was up almost 2% Year-over-Year ($653,500 vs $641,400) and up from November ($644,800).

Composite Benchmark Selling Price for the North Okanagan since March 2020. 
New Listings hitting the market were up 13% Year-over-Year (114 vs 101) which is about 21% above the 10-Year average (94).
Active Listings are up 12% Year-over-Year (710 vs 634), which puts the North Okanagan about 20% above the 10 year average (594) for the month of December.

The overall North Okanagan market continues to be in a balanced market.
The Sales to Active Listings ratio is 14% (up from 13% in November).
Between 12-25% is considered a Balanced Market.
The Sales to New Listing ratio is 86% (up from 63% in November).
Between 40-60% is considered a Balanced Market but ratios skew higher in the winter months when the number of new listings hitting the market are low.
Days to Sell Average is 81 days. This is down Year-over-Year (99) and unchanged from November (81).
Central Okanagan
Unit Sales in the Central Okanagan for December were down 4% Year-over-Year (240 vs 250), which is 13% below the 10 Year Average of 277. If you recall, November sales came in 25% below the 10 Year Average.
Benchmark Price
- Single Family homes price $1,045,700 which is basically unchanged Year-over-Year and up from November ($1,021,000)
- Townhome price $675,700 which is down 9.5% Year-over-Year and down from November ($752,800)
- Condo price is $470,600 which is unchanged Year-over-Year but down from November ($486,700)
- The Overall Composite Benchmark Price for the Central Okanagan was down Year-over-Year ($773,300 vs $784,100) and down from November ($787,700)

December saw 365 New Listings hit the market, which is up 9% Year-over-Year (334) and 13% above the 10-Year Average of 324.
And the 2358 current Active Listings is up 2% Year-over-Year (2309) and is 42% above the 10-year average of 1665.
With a Sales to Active Listings ratio of 10% and Sales to New Listings ratio of 66% the Central Okanagan continues to be in a Buyer's Market.